1980 United States presidential election in Alabama
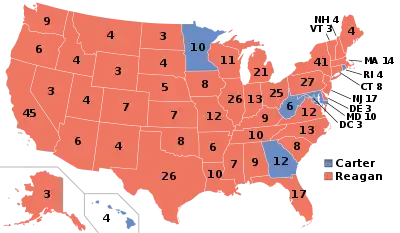
The United States presidential election in Alabama was held on November 4, 1980. Former California Governor Ronald Reagan narrowly won the state and its 9 electoral votes, winning 48.8% to incumbent President Jimmy Carter's 47.5%. John B. Anderson came in third place, winning 1.23%, although Alabama was Anderson's weakest state in the entire country. Two other candidates, Conservative Party nominee John Rarick and Libertarian Party candidate Ed Clark, each received close to one percent of the vote.
| ||||||||||||||||||||||||||
| ||||||||||||||||||||||||||
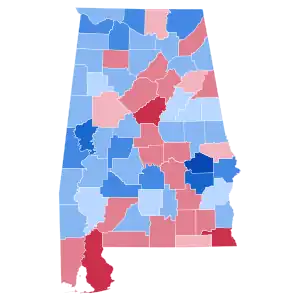
 County Results
| ||||||||||||||||||||||||||
| ||||||||||||||||||||||||||
| Elections in Alabama |
|---|
 |
|
|
As of the 2020 presidential election, this is the last election in which Limestone County, Morgan County, Marshall County, Talladega County, Cullman County, Tallapoosa County, Bibb County, Randolph County, Henry County, Lamar County, and Clay County voted for a Democratic presidential candidate. This is also the most recent election where Alabama was more Democratic than the nation at-large and where Alabama voted left of several modern-day blue and purple states like California, Connecticut, Illinois, New Jersey, New York, and Pennsylvania.[1]
59% of white voters supported Reagan while 36% supported Carter.[2][3]
Results
| Party | Nominee | Popular vote | Percentage | Electoral vote |
|---|---|---|---|---|
| Republican | Ronald Reagan | 654,192 | 48.75% | 9 |
| Democratic | Jimmy Carter | 636,730 | 47.45% | 0 |
| Independent | John B. Anderson | 16,481 | 1.23% | 0 |
| AL Conservative | John Rarick | 15,010 | 1.12% | 0 |
| Libertarian | Ed Clark | 13,318 | 0.99% | 0 |
| AL Statesman | Benjamin Bubar | 1,743 | 0.13% | 0 |
| Communist | Gus Hall | 1,629 | 0.12% | 0 |
| Socialist Workers | Clifton DeBerry | 1,303 | 0.10% | 0 |
| Socialist | David McReynolds | 1,006 | 0.07% | 0 |
| Citizens | Barry Commoner | 517 | 0.04% | 0 |
Result by county
| County | Ronald Reagan Republican |
Jimmy Carter Democratic |
John B. Anderson Independent |
John Rarick[5] Alabama Conservative |
Ed Clark[5] Libertarian |
Various candidates[5] Other parties |
Total votes cast | ||||||
|---|---|---|---|---|---|---|---|---|---|---|---|---|---|
| # | % | # | % | # | % | # | % | # | % | # | % | ||
| Autauga | 6,292 | 56.87% | 4,295 | 38.82% | 125 | 1.13% | 216 | 1.95% | 119 | 1.08% | 16 | 0.14% | 11,063 |
| Baldwin | 18,652 | 65.78% | 8,448 | 29.80% | 414 | 1.46% | 272 | 0.96% | 465 | 1.64% | 102 | 0.36% | 28,353 |
| Barbour | 4,171 | 46.34% | 4,458 | 49.53% | 65 | 0.72% | 202 | 2.24% | 80 | 0.89% | 25 | 0.28% | 9,001 |
| Bibb | 2,491 | 44.30% | 3,097 | 55.08% | 22 | 0.39% | 5 | 0.09% | 8 | 0.14% | 0 | 0.00% | 5,623 |
| Blount | 6,819 | 53.59% | 5,656 | 44.45% | 75 | 0.59% | 37 | 0.29% | 92 | 0.72% | 45 | 0.35% | 12,724 |
| Bullock | 1,446 | 25.65% | 3,960 | 70.25% | 29 | 0.51% | 158 | 2.80% | 33 | 0.59% | 11 | 0.20% | 5,637 |
| Butler | 3,810 | 45.53% | 4,156 | 49.67% | 59 | 0.71% | 205 | 2.45% | 107 | 1.28% | 31 | 0.37% | 8,368 |
| Calhoun | 17,475 | 49.17% | 17,017 | 47.88% | 433 | 1.22% | 90 | 0.25% | 286 | 0.80% | 240 | 0.68% | 35,541 |
| Chambers | 4,864 | 40.88% | 6,649 | 55.88% | 122 | 1.03% | 145 | 1.22% | 96 | 0.81% | 23 | 0.19% | 11,899 |
| Cherokee | 2,482 | 38.55% | 3,764 | 58.47% | 63 | 0.98% | 51 | 0.79% | 70 | 1.09% | 8 | 0.12% | 6,438 |
| Chilton | 6,615 | 57.64% | 4,706 | 41.00% | 60 | 0.52% | 17 | 0.15% | 46 | 0.40% | 33 | 0.29% | 11,477 |
| Choctaw | 2,859 | 43.45% | 3,680 | 55.93% | 22 | 0.33% | 5 | 0.08% | 14 | 0.21% | 0 | 0.00% | 6,580 |
| Clarke | 5,059 | 47.44% | 5,249 | 49.23% | 55 | 0.52% | 197 | 1.85% | 84 | 0.79% | 19 | 0.18% | 10,663 |
| Clay | 2,764 | 48.09% | 2,858 | 49.73% | 34 | 0.59% | 34 | 0.59% | 41 | 0.71% | 16 | 0.28% | 5,747 |
| Cleburne | 2,389 | 52.78% | 2,050 | 45.29% | 34 | 0.75% | 21 | 0.46% | 27 | 0.60% | 5 | 0.11% | 4,526 |
| Coffee | 6,760 | 50.45% | 6,140 | 45.82% | 189 | 1.41% | 153 | 1.14% | 137 | 1.02% | 20 | 0.15% | 13,399 |
| Colbert | 6,619 | 33.07% | 12,550 | 62.71% | 209 | 1.04% | 315 | 1.57% | 226 | 1.13% | 94 | 0.47% | 20,013 |
| Conecuh | 2,948 | 47.69% | 3,102 | 50.19% | 29 | 0.47% | 48 | 0.78% | 36 | 0.58% | 18 | 0.29% | 6,181 |
| Coosa | 1,714 | 40.72% | 2,383 | 56.62% | 19 | 0.45% | 55 | 1.31% | 25 | 0.59% | 13 | 0.31% | 4,209 |
| Covington | 7,014 | 51.54% | 6,305 | 46.33% | 110 | 0.81% | 55 | 0.40% | 70 | 0.51% | 54 | 0.40% | 13,608 |
| Crenshaw | 2,478 | 47.15% | 2,704 | 51.45% | 39 | 0.74% | 11 | 0.21% | 14 | 0.27% | 10 | 0.19% | 5,256 |
| Cullman | 10,212 | 45.92% | 11,525 | 51.82% | 228 | 1.03% | 81 | 0.36% | 124 | 0.56% | 70 | 0.31% | 22,240 |
| Dale | 7,247 | 57.64% | 4,936 | 39.26% | 134 | 1.07% | 112 | 0.89% | 130 | 1.03% | 14 | 0.11% | 12,573 |
| Dallas | 7,647 | 42.14% | 9,770 | 53.84% | 131 | 0.72% | 412 | 2.27% | 164 | 0.90% | 23 | 0.13% | 18,147 |
| DeKalb | 9,673 | 51.75% | 8,820 | 47.19% | 107 | 0.57% | 8 | 0.04% | 51 | 0.27% | 31 | 0.17% | 18,690 |
| Elmore | 8,688 | 57.20% | 5,947 | 39.15% | 171 | 1.13% | 219 | 1.44% | 140 | 0.92% | 25 | 0.16% | 15,190 |
| Escambia | 6,513 | 54.04% | 5,148 | 42.71% | 87 | 0.72% | 91 | 0.75% | 136 | 1.13% | 78 | 0.65% | 12,053 |
| Etowah | 16,177 | 42.79% | 20,790 | 54.99% | 358 | 0.95% | 147 | 0.39% | 234 | 0.62% | 100 | 0.26% | 37,806 |
| Fayette | 3,315 | 48.83% | 3,389 | 49.92% | 47 | 0.69% | 4 | 0.06% | 23 | 0.34% | 11 | 0.16% | 6,789 |
| Franklin | 4,448 | 41.33% | 6,136 | 57.01% | 51 | 0.47% | 30 | 0.28% | 66 | 0.61% | 32 | 0.30% | 10,763 |
| Geneva | 4,747 | 49.30% | 4,703 | 48.85% | 67 | 0.70% | 45 | 0.47% | 45 | 0.47% | 21 | 0.22% | 9,628 |
| Greene | 1,034 | 22.79% | 3,474 | 76.55% | 16 | 0.35% | 6 | 0.13% | 7 | 0.15% | 1 | 0.02% | 4,538 |
| Hale | 2,074 | 34.69% | 3,583 | 59.93% | 56 | 0.94% | 224 | 3.75% | 35 | 0.59% | 7 | 0.12% | 5,979 |
| Henry | 2,813 | 47.85% | 2,973 | 50.57% | 18 | 0.31% | 29 | 0.49% | 26 | 0.44% | 20 | 0.34% | 5,879 |
| Houston | 14,884 | 64.05% | 7,848 | 33.77% | 184 | 0.79% | 104 | 0.45% | 132 | 0.57% | 86 | 0.37% | 23,238 |
| Jackson | 4,897 | 34.48% | 8,776 | 61.79% | 156 | 1.10% | 185 | 1.30% | 176 | 1.24% | 13 | 0.09% | 14,203 |
| Jefferson | 132,612 | 51.10% | 113,069 | 43.57% | 3,509 | 1.35% | 4,054 | 1.56% | 3,243 | 1.25% | 3,025 | 1.17% | 259,512 |
| Lamar | 2,778 | 44.91% | 3,366 | 54.41% | 16 | 0.26% | 5 | 0.08% | 15 | 0.24% | 6 | 0.10% | 6,186 |
| Lauderdale | 10,467 | 38.42% | 15,379 | 56.45% | 431 | 1.58% | 363 | 1.33% | 496 | 1.82% | 107 | 0.39% | 27,243 |
| Lawrence | 2,456 | 28.09% | 6,112 | 69.92% | 64 | 0.73% | 30 | 0.34% | 54 | 0.62% | 26 | 0.30% | 8,742 |
| Lee | 10,982 | 49.98% | 9,606 | 43.72% | 643 | 2.93% | 290 | 1.32% | 421 | 1.92% | 30 | 0.14% | 21,972 |
| Limestone | 4,574 | 34.18% | 8,180 | 61.12% | 183 | 1.37% | 258 | 1.93% | 172 | 1.29% | 17 | 0.13% | 13,384 |
| Lowndes | 1,524 | 28.60% | 3,577 | 67.12% | 15 | 0.28% | 172 | 3.23% | 27 | 0.51% | 14 | 0.26% | 5,329 |
| Macon | 1,259 | 14.35% | 7,028 | 80.10% | 36 | 0.41% | 366 | 4.17% | 38 | 0.43% | 47 | 0.54% | 8,774 |
| Madison | 30,604 | 47.03% | 30,469 | 46.82% | 2,246 | 3.45% | 713 | 1.10% | 900 | 1.38% | 140 | 0.22% | 65,072 |
| Marengo | 4,048 | 41.90% | 5,178 | 53.60% | 35 | 0.36% | 255 | 2.64% | 113 | 1.17% | 31 | 0.32% | 9,660 |
| Marion | 5,182 | 48.26% | 5,450 | 50.75% | 61 | 0.57% | 3 | 0.03% | 28 | 0.26% | 14 | 0.13% | 10,738 |
| Marshall | 8,159 | 40.93% | 10,854 | 54.45% | 283 | 1.42% | 254 | 1.27% | 362 | 1.82% | 21 | 0.11% | 19,933 |
| Mobile | 67,515 | 57.71% | 46,180 | 39.47% | 1,333 | 1.14% | 563 | 0.48% | 899 | 0.77% | 502 | 0.43% | 116,992 |
| Monroe | 4,615 | 50.87% | 4,262 | 46.98% | 43 | 0.47% | 51 | 0.56% | 71 | 0.78% | 30 | 0.33% | 9,072 |
| Montgomery | 35,745 | 53.75% | 28,018 | 42.13% | 985 | 1.48% | 1,149 | 1.73% | 503 | 0.76% | 104 | 0.16% | 66,504 |
| Morgan | 13,214 | 45.14% | 14,703 | 50.23% | 457 | 1.56% | 297 | 1.01% | 444 | 1.52% | 156 | 0.53% | 29,271 |
| Perry | 2,262 | 34.68% | 4,208 | 64.52% | 28 | 0.43% | 7 | 0.11% | 13 | 0.20% | 4 | 0.06% | 6,522 |
| Pickens | 3,582 | 43.78% | 4,504 | 55.05% | 61 | 0.75% | 9 | 0.11% | 22 | 0.27% | 4 | 0.05% | 8,182 |
| Pike | 5,220 | 52.25% | 4,417 | 44.21% | 83 | 0.83% | 158 | 1.58% | 74 | 0.74% | 39 | 0.39% | 9,991 |
| Randolph | 3,279 | 46.22% | 3,378 | 47.62% | 58 | 0.82% | 169 | 2.38% | 168 | 2.37% | 42 | 0.59% | 7,094 |
| Russell | 4,485 | 33.22% | 8,123 | 60.17% | 137 | 1.01% | 522 | 3.87% | 213 | 1.58% | 20 | 0.15% | 13,500 |
| Shelby | 14,957 | 64.28% | 7,396 | 31.79% | 407 | 1.75% | 183 | 0.79% | 290 | 1.25% | 34 | 0.15% | 23,267 |
| St. Clair | 7,768 | 56.89% | 5,236 | 38.35% | 121 | 0.89% | 190 | 1.39% | 322 | 2.36% | 17 | 0.12% | 13,654 |
| Sumter | 2,104 | 29.23% | 5,015 | 69.66% | 45 | 0.63% | 8 | 0.11% | 16 | 0.22% | 11 | 0.15% | 7,199 |
| Talladega | 9,902 | 47.97% | 10,159 | 49.22% | 140 | 0.68% | 99 | 0.48% | 153 | 0.74% | 188 | 0.91% | 20,641 |
| Tallapoosa | 5,958 | 43.80% | 7,260 | 53.37% | 96 | 0.71% | 161 | 1.18% | 88 | 0.65% | 40 | 0.29% | 13,603 |
| Tuscaloosa | 19,750 | 48.50% | 19,103 | 46.91% | 789 | 1.94% | 582 | 1.44% | 397 | 0.98% | 99 | 0.24% | 40,720 |
| Walker | 8,795 | 38.53% | 13,616 | 59.65% | 82 | 0.36% | 96 | 0.42% | 152 | 0.67% | 87 | 0.38% | 22,828 |
| Washington | 3,045 | 45.96% | 3,520 | 53.13% | 24 | 0.36% | 2 | 0.03% | 31 | 0.47% | 3 | 0.05% | 6,625 |
| Wilcox | 2,280 | 31.40% | 4,951 | 68.19% | 13 | 0.18% | 7 | 0.10% | 8 | 0.11% | 2 | 0.03% | 7,261 |
| Winston | 4,981 | 59.04% | 3,368 | 39.92% | 39 | 0.46% | 5 | 0.06% | 20 | 0.24% | 23 | 0.27% | 8,436 |
| Totals | 654,192 | 48.75% | 636,730 | 47.45% | 16,481 | 1.23% | 15,010 | 1.12% | 13,318 | 0.99% | 6,198 | 0.46% | 1,341,929 |
References
- Sullivan, Robert David; ‘How the Red and Blue Map Evolved Over the Past Century’; America Magazine in The National Catholic Review; June 29, 2016
- Black & Black 1992, p. 295.
- Black & Black 1992, p. 335.
- Leip, Dave. "1980 Presidential General Election Results – Alabama". Dave Leip’s U.S. Election Atlas.
- "AL US President Race, November 4, 1980". Our Campaigns.
Works cited
- Black, Earl; Black, Merle (1992). The Vital South: How Presidents Are Elected. Harvard University Press. ISBN 0674941306.


