Growth of photovoltaics
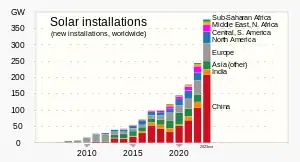
Between 1992 and 2022, the worldwide usage of photovoltaics (PV) increased exponentially. During this period, it evolved from a niche market of small-scale applications to a mainstream electricity source.[3] From 2016-2022 it has seen an annual capacity and production growth rate of around 26%- doubling approximately every three years.
When solar PV systems were first recognized as a promising renewable energy technology, subsidy programs, such as feed-in tariffs, were implemented by a number of governments in order to provide economic incentives for investments. For several years, growth was mainly driven by Japan and pioneering European countries. As a consequence, cost of solar declined significantly due to experience curve effects like improvements in technology and economies of scale. Several national programs were instrumental in increasing PV deployment, such as the Energiewende in Germany, the Million Solar Roofs project in the United States, and China's 2011 five-year-plan for energy production.[4] Since then, deployment of photovoltaics has gained momentum on a worldwide scale, increasingly competing with conventional energy sources. In the early 21st century a market for utility-scale plants emerged to complement rooftop and other distributed applications.[5] By 2015, some 30 countries had reached grid parity.[6]: 9
Since the 1950s, when the first solar cells were commercially manufactured, there has been a succession of countries leading the world as the largest producer of electricity from solar photovoltaics. First it was the United States, then Japan,[7] followed by Germany, and currently China.
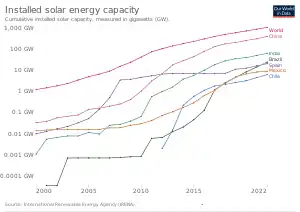
By the end of 2022, the global cumulative installed PV capacity reached about 1,185 gigawatts (GW), supplying over 6% of global electricity demand,[8] up from about 3% in 2019.[9] In 2022, solar PV contributed over 10% of the annual domestic consumption of electricity in nine countries, with Spain, Greece and Chile over 17%.[8]
Projections for photovoltaic growth are difficult and burdened with many uncertainties. Official agencies, such as the International Energy Agency (IEA) have consistently increased their estimates for decades, while still falling far short of projecting actual deployment in every forecast.[10][11][12] Bloomberg NEF projects global solar installations to grow in 2019, adding another 125–141 GW resulting in a total capacity of 637–653 GW by the end of the year.[13] By 2050, the IEA foresees solar PV to reach 4.7 terawatts (4,674 GW) in its high-renewable scenario, of which more than half will be deployed in China and India, making solar power the world's largest source of electricity.[14][15]
Solar PV nameplate capacity
Nameplate capacity denotes the peak power output of power stations in unit watt prefixed as convenient, to e.g. kilowatt (kW), megawatt (MW) and gigawatt (GW). Because power output for variable renewable sources is unpredictable, a source's average generation is generally significantly lower than the nameplate capacity. In order to have an estimate of the average power output, the capacity can be multiplied by a suitable capacity factor, which takes into account varying conditions - weather, nighttime, latitude, maintenance. Worldwide, the average solar PV capacity factor is 11%.[16] In addition, depending on context, the stated peak power may be prior to a subsequent conversion to alternating current, e.g. for a single photovoltaic panel, or include this conversion and its loss for a grid connected photovoltaic power station.[17]: 15 [18]: 10
Wind power has different characteristics, e.g. a higher capacity factor and about four times the 2015 electricity production of solar power. Compared with wind power, photovoltaic power production correlates well with power consumption for air-conditioning in warm countries. As of 2017, a handful of utilities have started combining PV installations with battery banks, thus obtaining several hours of dispatchable generation to help mitigate problems associated with the duck curve after sunset.[19][20]
Current status
Worldwide
In 2022, the total global photovoltaic capacity increased by 228 GW, with a 24% growth year-on-year of new installations. As a result, the total global capacity exceeded 1,185 GW by the end of the year.
Regions
As of 2018, Asia was the fastest growing region, with almost 75% of global installations. China alone accounted for more than half of worldwide deployment in 2017. In terms of cumulative capacity, Asia was the most developed region with more than half of the global total of 401 GW in 2017.[21] Europe continued to decline as a percentage of the global PV market. In 2017, Europe represented 28% of global capacity, the Americas 19% and Middle East 2%.[21] However, with respect to per capita installation the European Union has more than twice the capacity compared to China and 25% more than the US.
Countries and territories
The worldwide growth of photovoltaics is extremely dynamic and varies strongly by country. In April 2022, the total global solar power capacity reached 1 TW. In 2022, the leading country for solar power was China, with about 390 GW, accounting for nearly two-fifths of the total global installed solar capacity. As of 2022, there are more than 40 countries around the world with a cumulative PV capacity of more than one gigawatt, incl. Canada, South Africa, Chile, the United Kingdom, South Korea, Austria, Argentina and the Philippines. The top installers of 2022 included China, the United States, India, Brazil and Germany.[22]
| 2016[23] | 2017[21] | 2018[24][25] | 2019[9][26] | 2020[27][28] | 2021[29][30] | 2022[31] | W per capita 2019 |
W per capita 2021 |
Share of total consumption1 | ||||||||
|---|---|---|---|---|---|---|---|---|---|---|---|---|---|---|---|---|---|
| Country or territory | New | Total | New | Total | New | Total | New | Total | New | Total | New | Total | New | Total | |||
| 34,540 | 78,070 | 53,000 | 131,000 | 45,000 | 175,018 | 30,100 | 204,700 | 49,655 | 254,355 | 52,618 | 306,973 | 86,059 | 393,032 | 147 | 217 | 6.5% (2022)[32] | |
| 91,890 | 4,737 | 96,627 | 7,832 | 104,459 | 16,186 | 120,645 | 18,296 | 138,941 | 25,734 | 164,675 | 35,972 | 200,647 | 295 | 400 | 8.7% (2022)[32] | ||
| 14,730 | 40,300 | 10,600 | 51,000 | 10,600 | 53,184 | 13,300 | 60,682 | 14,890 | 75,572 | 19,637 | 95,209 | 17,806 | 113,015 | 184 | 289 | 5.1% (2022)[32] | |
| 8,600 | 42,750 | 7,000 | 49,000 | 6,500 | 55,500 | 7,000 | 63,000 | 4,000 | 67,000 | 7,191 | 74,191 | 4,642 | 78,833 | 498 | 590 | 10.2% (2022)[32] | |
| 1,520 | 41,220 | 1,800 | 42,000 | 3,000 | 45,930 | 3,900 | 49,200 | 4,583 | 53,783 | 4,678 | 58,461 | 8,093 | 66,554 | 593 | 711 | 12.4% (2022)[32] | |
| 3,970 | 9,010 | 9,100 | 18,300 | 10,800 | 26,869 | 9,900 | 35,089 | 4,122 | 39,211 | 10,473 | 49,684 | 13,462 | 63,146 | 32 | 36 | 9.5% (2022)[32] | |
| 839 | 5,900 | 1,250 | 7,200 | 3,800 | 11,300 | 3,700 | 15,928 | 1,699 | 17,627 | 1,449 | 19,076 | 7,716 | 26,792 | 637 | 990 | 15.7% (2022)[32] | |
| 373 | 19,279 | 409 | 19,700 | 420 | 20,120 | 600 | 20,800 | 800 | 21,600 | 1,098 | 22,698 | 2,385 | 25,083 | 345 | 381 | 9.1% (2022)[32] | |
| 200 | 900 | 1,100 | 1,313 | 2,413 | 2,138 | 4,595 | 3,145 | 7,881 | 5,827 | 14,197 | 9,882 | 24,079 | 22 | 64 | 2.5% (2021)[35] | ||
| 850 | 4,350 | 1,200 | 5,600 | 2,000 | 7,862 | 3,100 | 11,200 | 3,375 | 14,575 | 3,586 | 18,161 | 2,814 | 20,975 | 217 | 350 | 4.7% (2022)[32] | |
| 4,669 | 19 | 4,688 | 19 | 4,707 | 4,004 | 8,711 | 5,378 | 14,089 | 1,863 | 15,952 | 4,566 | 20,518 | 186 | 237 | 19.1% (2022)[32] | ||
| 519 | 2,135 | 776 | 2,911 | 1,697 | 4,608 | 2,618 | 7,226 | 3,882 | 11,108 | 3,803 | 14,911 | 4,232 | 19,143 | 396 | 757 | 14.3% (2022)[37] | |
| 6 | 3 | 9 | 97 | 106 | 4,800 | 5,695 | 10,909 | 16,504 | 156 | 16,660 | 1,814 | 18,474 | 60 | 171 | 9.9% (2022)[38] | ||
| 559 | 7,130 | 870 | 8,000 | 1,483 | 9,483 | 417 | 9,900 | 1,833 | 11,733 | 2,985 | 14,718 | 2,701 | 17,419 | 148 | 218 | 4.6% (2022)[32] | |
| 1,970 | 11,630 | 900 | 12,700 | 408 | 13,108 | 233 | 13,346 | 177 | 13,563 | 126 | 13,689 | 723 | 14,412 | 200 | 203 | 4.7% (2022)[32] | |
| 487 | 813 | 1,300 | 2,636 | 3,936 | 2,321 | 6,257 | 4,910 | 11,167 | 34 | 165 | 5.4% (2022)[39] | ||||||
| 2,618 | 1,482 | 4,100 | 1,717 | 5,817 | 1,883 | 7,700 | 2,024 | 9,724 | 172 | 327 | 3.7% (2022)[38] | ||||||
| 584 | 832 | 2,600 | 3,400 | 1,600 | 5,063 | 932 | 5,995 | 673 | 6,668 | 1,149 | 7,817 | 1,609 | 9,426 | 73 | 92 | 6.6% (2022)[32] | |
| 150 | 320 | 150 | 539 | 2,700 | 3,200 | 1,226 | 4,426 | 1,218 | 5,644 | 1,396 | 7,040 | 1,986 | 9,026 | 35 | 55 | 5.2% (2022)[32] | |
| 99 | 531 | 211 | 742 | 1,200 | 2,003 | 1,557 | 3,560 | 1,800 | 5,360 | 2,702 | 8,062 | 0 | 8,062 | 114 | 183 | 5.0% (2020)[40] | |
| 170 | 3,422 | 284 | 3,800 | 226 | 4,026 | 505 | 4,531 | 1,115 | 5,646 | 939 | 6,585 | 313 | 6,898 | 394 | 569 | 8.7% (2022)[32] | |
| 536 | 1,450 | 13 | 1,800 | 759 | 2,559 | 2 | 2,561 | 3,429 | 5,990 | 231 | 6,221 | 105 | 6,326 | 44 | 105 | 4.2% (2022)[32] | |
| 746 | 1,610 | 668 | 1,800 | 337 | 2,137 | 511 | 2,648 | 557 | 3,205 | 1,263 | 4,468 | 1,782 | 6,250 | 142 | 234 | 17.0% (2022)[32] | |
| 2,652 | 111 | 2,763 | 484 | 3,247 | 1,030 | 4,277 | 1,280 | 5,557 | 258 | 329 | 17.5% (2022)[32] | ||||||
| 250 | 1,640 | 260 | 1,900 | 346 | 2,246 | 332 | 2,498 | 493 | 2,973 | 683 | 3,449 | 1,084 | 4,533 | 295 | 412 | 7.1% (2022)[32] | |
| 130 | 910 | 60 | 1,100 | -30 | 1,070 | 120 | 1,190 | 1,059 | 2,249 | 306 | 2,555 | 1,856 | 4,411 | 134 | 277 | 12.3% (2022)[32] | |
| 200 | 2,715 | 212 | 2,900 | 213 | 3,113 | 197 | 3,310 | 15 | 3,325 | 305 | 3,630 | 771 | 4,401 | 88 | 96 | 1.0% (2022)[32] | |
| 154 | 1,077 | 153 | 1,250 | 181 | 1,431 | 147 | 1,578 | 642 | 2,220 | 472 | 2,692 | 856 | 3,548 | 178 | 302 | 5.9% (2022)[32] | |
| 726 | 2,150 | 251 | 2,700 | 20 | 2,720 | 262 | 2,982 | 6 | 2,988 | 77 | 3,065 | 0 | 3,065 | 43 | 44 | 3.4% (2022)[32] | |
| 42 | 213 | 255 | 239 | 494 | 1,289 | 1,783 | 756 | 2,539 | 166 | 2,705 | 335 | 3,040 | 185 | 273 | 4.9% (2021)[38] | ||
| 665 | 612 | 1,277 | 676 | 1,953 | 178 | 2,131 | 857 | 2,988 | 131 | 218 | 11.1% (2021)[41] | ||||||
| 48 | 2,131 | 63 | 2,193 | -115 | 2,078 | -8 | 2,070 | 3 | 2,073 | 46 | 2,119 | 508 | 2,627 | 194 | 198 | 3.5% (2022)[32] | |
| 60 | 175 | 93 | 303 | 118 | 421 | 223 | 644 | 773 | 1,417 | 160 | 1,577 | 1,029 | 2,606 | 63 | 152 | 1.9% (2022)[32] | |
| 58 | 513 | 57 | 577 | 93 | 670 | 158 | 828 | 197 | 1,025 | 776 | 1,801 | 735 | 2,536 | 81 | 174 | 8.4% (2022)[32] | |
| 70 | 900 | 60 | 910 | 88 | 998 | 81 | 1,079 | 221 | 1,300 | 240 | 1,540 | 950 | 2,490 | 186 | 264 | 7.3% (2022)[32] | |
| 58 | 117 | 175 | 315 | 490 | 660 | 1,150 | 569 | 1,719 | 204 | 1,923 | 108 | 2,031 | 1.2% (2022)[38] | ||||
| 1,028 | 8 | 1,036 | 0 | 1,036 | 29 | 1,065 | 8 | 1,073 | 202 | 1,275 | 673 | 1,948 | 152 | 171 | 5.8% (2022)[32] | ||
| 54 | 286 | 50 | 386 | 52 | 438 | 444 | 882 | 611 | 1,493 | 294 | 1,787 | 146 | 1,933 | 28 | 55 | 0.6% (2022)[32] | |
| 298 | 173 | 471 | 358 | 829 | 169 | 998 | 361 | 1,359 | 162 | 1,521 | 393 | 1,914 | 100 | 149 | 16.0% (2021)[38] | ||
| 15 | 77 | 159 | 236 | 310 | 546 | 518 | 1,064 | 364 | 1,428 | 233 | 1,661 | 155 | 1,816 | 7 | 11 | 0.2% (2022)[38] | |
| 48 | 121 | 169 | 581 | 750 | 897 | 1,647 | 47 | 1,694 | -19 | 1,675 | 49 | 1,724 | 17 | 17 | |||
| 756 | 900 | 886 | 36 | 922 | 126 | 1,048 | 322 | 1,370 | 255 | 1,625 | 9 | 13 | |||||
| 1,372 | 2 | 1,374 | 3 | 1,377 | 9 | 1,386 | 1 | 1,387 | 11 | 1,398 | 16 | 1,414 | 71 | 74 | 4.4% (2022)[32] | ||
| 589 | 66 | 655 | 24 | 679 | 34 | 713 | 24 | 737 | 346 | 1,083 | 160 | 1,243 | 6 | 6 | |||
| 9 | 0 | 9 | 182 | 191 | 251 | 442 | 322 | 764 | 307 | 1,071 | 33 | 1,104 | 10 | 24 | 2.1% (2022)[42] | ||
| 202 | 2 | 204 | 530 | 734 | 0 | 734 | 0 | 774 | 80 | 854 | 4 | 858 | 6 | 21 | 4.8% (2022)[32] | ||
| 73 | 33 | 106 | 99 | 205 | 100 | 305 | 65 | 370 | 224 | 594 | 148 | 742 | 45 | ||||
| 63 | 68 | 131 | 54 | 185 | 100 | 285 | 146 | 431 | 193 | 624 | 90 | 714 | 20 | ||||
| 28 | 98 | 126 | 80 | 206 | 187 | 403 | 75 | 478 | 165 | 643 | 21 | 664 | 74 | ||||
| 247 | 55 | 302 | 3 | 305 | 31 | 336 | 48 | 384 | 104 | 491 | 148 | 639 | 154 | ||||
| 2 | 6 | 8 | 0 | 8 | 1 | 9 | 100 | 109 | 29 | 138 | 500 | 638 | 27 | ||||
| 232 | 15 | 247 | 0 | 247 | 17 | 264 | 106 | 370 | 91 | 461 | 171 | 632 | 175 | ||||
| 17 | 37 | 23 | 80 | 54 | 134 | 81 | 215 | 176 | 391 | 34 | 425 | 166 | 591 | 39 | 73 | 0.4% (2022)[32] | |
| 97 | 21 | 118 | 42 | 160 | 95 | 255 | 74 | 329 | 158 | 487 | 85 | 572 | 45 | 76 | 0.8% (2018)[44] | ||
| 1 | 70 | 4 | 74 | 10 | 84 | 19 | 103 | 61 | 164 | 91 | 255 | 313 | 568 | 37 | 121 | 10.3% (2022)[45] | |
| 34 | 43 | 141 | 184 | 102 | 286 | 81 | 367 | 85 | 414 | 42 | 456 | 83 | 539 | 5 | 5 | 0.4% (2019)[25] | |
| 533 | -5 | 528 | -56 | 472 | 0 | 472 | 63 | 535 | 0 | 537 | 0 | 537 | 87 | 98 | 2.4% (2022)[32] | ||
| 161 | 24 | 185 | 16 | 201 | 83 | 284 | 33 | 317 | 163 | 480 | 57 | 537 | 2 | 2 | |||
| 10 | 5 | 15 | 17 | 32 | 89 | 121 | 87 | 208 | 187 | 395 | 140 | 535 | 311 | ||||
| 414 | 37 | 451 | 34 | 485 | 26 | 511 | 14 | 525 | 4 | 529 | 0 | 529 | 53 | 53 | 12.9% (2022)[32] | ||
| 93 | 54 | 147 | 46 | 193 | 5 | 198 | 0 | 198 | 267 | 465 | 57 | 522 | 108 | ||||
| 14 | 84 | 21 | 105 | 8 | 113 | 16 | 129 | 71 | 200 | 116 | 316 | 148 | 464 | 147 | 262 | 3.3% (2016)[46] | |
| 219 | 181 | 400 | 23 | 423 | 0 | 423 | 25 | 448 | 0 | 448 | 12 | 460 | 10 | 10 | |||
| 2 | 9 | 11 | 75 | 86 | 4 | 90 | 17 | 107 | 77 | 184 | 273 | 457 | 4 | ||||
| 18 | 9 | 29 | 0 | 29 | 95 | 124 | 191 | 315 | 61 | 376 | 80 | 456 | 26 | ||||
| 24 | 10 | 34 | 50 | 84 | 325 | 409 | 0 | 409 | 30 | 439 | 1 | 440 | 13 | ||||
| 146 | 152 | 298 | 27 | 325 | 6 | 331 | 0 | 331 | 1 | 332 | 0 | 332 | 10 | ||||
| 11 | 27 | 18 | 45 | 23 | 68 | 22 | 90 | 62 | 152 | 53 | 205 | 116 | 321 | 17 | 42 | 0.2% (2022)[32] | |
| 122 | 5 | 127 | 7 | 134 | 16 | 150 | 45 | 195 | 83 | 277 | 42 | 319 | 244 | 330 | |||
| 32 | 14 | 46 | 61 | 107 | 20 | 127 | 20 | 147 | 71 | 218 | 89 | 307 | 3 | ||||
| 1 | 1 | 2 | 15 | 17 | 34 | 50 | 56 | 106 | 111 | 217 | 89 | 306 | 62 | ||||
| 53 | 17 | 70 | 20 | 90 | 27 | 117 | 25 | 142 | 95 | 237 | 66 | 303 | 29 | ||||
| 88 | 10 | 98 | 0 | 98 | 57 | 155 | 17 | 172 | 53 | 225 | 66 | 291 | 0.77 | ||||
| 89 | 154 | 243 | 5 | 248 | 6 | 254 | 2 | 256 | 2 | 258 | 12 | 270 | 69 | ||||
| 51 | 102 | 153 | 4 | 157 | 0 | 157 | 2 | 159 | 1 | 160 | 109 | 269 | 29 | ||||
| 43 | 70 | 113 | 21 | 134 | 0 | 134 | 21 | 155 | 83 | 238 | 25 | 263 | 8 | 14 | |||
| 37 | 28 | 65 | 123 | 128 | 31 | 159 | 4 | 163 | 83 | 246 | 12 | 258 | 22 | ||||
| 80 | 20 | 100 | 150 | 250 | 0 | 250 | 3 | 253 | 0 | 253 | 4 | 257 | 8 | ||||
| 2 | 1 | 3 | 1 | 4 | 0 | 4 | 0 | 4 | 100 | 104 | 149 | 253 | 3 | ||||
| 18 | 1 | 19 | 0 | 19 | 0 | 19 | 40 | 59 | 30 | 89 | 140 | 229 | 5 | ||||
| 20 | 93 | 19 | 112 | 15 | 127 | 27 | 154 | 30 | 184 | 22 | 206 | 0 | 206 | 312 | 373 | 9.6% (2021)[47] | |
| 26 | 10 | 36 | 23 | 59 | 21 | 80 | 37 | 117 | 19 | 136 | 54 | 190 | 3 | ||||
| 8 | 56 | 4 | 60 | 1 | 68 | 17 | 85 | 24 | 109 | 19 | 138 | 44 | 182 | 17 | 27 | ||
| 36 | 34 | 70 | 18 | 88 | 63 | 151 | 0 | 151 | 0 | 151 | 25 | 176 | 55 | 57 | |||
| 6 | 2 | 8 | 62 | 70 | 50 | 120 | 0 | 120 | 50 | 170 | 0 | 170 | 15 | ||||
| 12 | 7 | 19 | 7 | 26 | 54 | 80 | 2 | 82 | 59 | 141 | 2 | 143 | 7 | ||||
| 6 | 11 | 17 | 15 | 32 | 26 | 58 | 35 | 93 | 42 | 135 | 0 | 135 | 27 | ||||
| 2 | 3 | 25 | 28 | 10 | 38 | 7 | 45 | 25 | 70 | 23 | 93 | 24 | 117 | 17 | 3 | 0.1% (2020)[27] | |
| 93 | 6 | 99 | 2 | 101 | 0 | 101 | 0 | 101 | 0 | 101 | 4 | 105 | 6 | ||||
| 38 | 9 | 47 | 19 | 66 | 6 | 72 | 23 | 95 | 3 | 98 | 0 | 98 | 3 | ||||
| 37 | 0 | 37 | 0 | 37 | 0 | 37 | 0 | 37 | 0 | 37 | 5 | 42 | |||||
| World total | 76,800 | 306,500 | 95,000 | 401,500 | 108,500 | 510,000 | 70,760 | 580,760 | 133,210 | 713,970 | 135,503 | 849,473 | 203,642 | 1,053,115 | 83 | 108 | 6.2% (2022)[32] |
| 1 Share of total electricity consumption for latest available year | |||||||||||||||||
History of leading countries
The United States was the leader of installed photovoltaics for many years, and its total capacity was 77 megawatts in 1996, more than any other country in the world at the time. From the late 1990s, Japan was the world's leader of solar electricity production until 2005, when Germany took the lead and by 2016 had a capacity of over 40 gigawatts. In 2015, China surpassed Germany to become the world's largest producer of photovoltaic power,[48] and in 2017 became the first country to surpass 100 GW of installed capacity. Leading countries per capita in 2022 were Australia, Netherlands and Germany.
United States (1954–1996)
The United States, where modern solar PV was invented, led installed capacity for many years. Based on preceding work by Swedish and German engineers, the American engineer Russell Ohl at Bell Labs patented the first modern solar cell in 1946.[49][50][51] It was also there at Bell Labs where the first practical c-silicon cell was developed in 1954.[52][53] Hoffman Electronics, the leading manufacturer of silicon solar cells in the 1950s and 1960s, improved on the cell's efficiency, produced solar radios, and equipped Vanguard I, the first solar powered satellite launched into orbit in 1958.
In 1977 US-President Jimmy Carter installed solar hot water panels on the White House (later removed by President Reagan) promoting solar energy[54] and the National Renewable Energy Laboratory, originally named Solar Energy Research Institute was established at Golden, Colorado. In the 1980s and early 1990s, most photovoltaic modules were used in stand-alone power systems or powered consumer products such as watches, calculators and toys, but from around 1995, industry efforts have focused increasingly on developing grid-connected rooftop PV systems and power stations. By 1996, solar PV capacity in the US amounted to 77 megawatts–more than any other country in the world at the time. Then, Japan moved ahead.
Japan (1997–2004)
Japan took the lead as the world's largest producer of PV electricity, after the city of Kobe was hit by the Great Hanshin earthquake in 1995. Kobe experienced severe power outages in the aftermath of the earthquake, and PV systems were then considered as a temporary supplier of power during such events, as the disruption of the electric grid paralyzed the entire infrastructure, including gas stations that depended on electricity to pump gasoline. Moreover, in December of that same year, an accident occurred at the multibillion-dollar experimental Monju Nuclear Power Plant. A sodium leak caused a major fire and forced a shutdown (classified as INES 1). There was massive public outrage when it was revealed that the semigovernmental agency in charge of Monju had tried to cover up the extent of the accident and resulting damage.[55][56] Japan remained world leader in photovoltaics until 2004, when its capacity amounted to 1,132 megawatts. Then, focus on PV deployment shifted to Europe.
Germany (2005–2014)
In 2005, Germany took the lead from Japan. With the introduction of the Renewable Energy Act in 2000, feed-in tariffs were adopted as a policy mechanism. This policy established that renewables have priority on the grid, and that a fixed price must be paid for the produced electricity over a 20-year period, providing a guaranteed return on investment irrespective of actual market prices. As a consequence, a high level of investment security lead to a soaring number of new photovoltaic installations that peaked in 2011, while investment costs in renewable technologies were brought down considerably. In 2016 Germany's installed PV capacity was over the 40 GW mark.
China (2015–present)
China surpassed Germany's capacity by the end of 2015, becoming the world's largest producer of photovoltaic power.[57] China's rapid PV growth continued in 2016 – with 34.2 GW of solar photovoltaics installed.[58] The quickly lowering feed in tariff rates[59] at the end of 2015 motivated many developers to secure tariff rates before mid-year 2016 – as they were anticipating further cuts (correctly so[60]). During the course of the year, China announced its goal of installing 100 GW during the next Chinese Five Year Economic Plan (2016–2020). China expected to spend ¥1 trillion ($145B) on solar construction[61] during that period. Much of China's PV capacity was built in the relatively less populated west of the country whereas the main centres of power consumption were in the east (such as Shanghai and Beijing).[62] Due to lack of adequate power transmission lines to carry the power from the solar power plants, China had to curtail its PV generated power.[62][63][64]
History of market development
Prices and costs (1977–present)


| Type of cell or module | Price per Watt |
|---|---|
| Multi-Si Cell (≥18.6%) | $0.071 |
| Mono-Si Cell (≥20.0%) | $0.090 |
| G1 Mono-Si Cell (>21.7%) | $0.099 |
| M6 Mono-Si Cell (>21.7%) | $0.100 |
| 275W - 280W (60P) Module | $0.176 |
| 325W - 330W (72P) Module | $0.188 |
| 305W - 310W Module | $0.240 |
| 315W - 320W Module | $0.190 |
| >325W - >385W Module | $0.200 |
| Source: EnergyTrend, price quotes, average prices, 13 July 2020[66] | |
The average price per watt dropped drastically for solar cells in the decades leading up to 2017. While in 1977 prices for crystalline silicon cells were about $77 per watt, average spot prices in August 2018 were as low as $0.13 per watt or nearly 600 times less than forty years ago. Prices for thin-film solar cells and for c-Si solar panels were around $.60 per watt.[67] Module and cell prices declined even further after 2014 (see price quotes in table).
This price trend was seen as evidence supporting Swanson's law (an observation similar to the famous Moore's Law) that states that the per-watt cost of solar cells and panels fall by 20 percent for every doubling of cumulative photovoltaic production.[68] A 2015 study showed price/kWh dropping by 10% per year since 1980, and predicted that solar could contribute 20% of total electricity consumption by 2030.[69]
In its 2014 edition of the Technology Roadmap: Solar Photovoltaic Energy report, the International Energy Agency (IEA) published prices for residential, commercial and utility-scale PV systems for eight major markets as of 2013 (see table below).[14] However, DOE's SunShot Initiative report states lower prices than the IEA report, although both reports were published at the same time and referred to the same period. After 2014 prices fell further. For 2014, the SunShot Initiative modeled U.S. system prices to be in the range of $1.80 to $3.29 per watt.[70] Other sources identified similar price ranges of $1.70 to $3.50 for the different market segments in the U.S.[71] In the highly penetrated German market, prices for residential and small commercial rooftop systems of up to 100 kW declined to $1.36 per watt (€1.24/W) by the end of 2014.[72] In 2015, Deutsche Bank estimated costs for small residential rooftop systems in the U.S. around $2.90 per watt. Costs for utility-scale systems in China and India were estimated as low as $1.00 per watt.[6]: 9
| USD/W | Australia | China | France | Germany | Italy | Japan | United Kingdom | United States |
|---|---|---|---|---|---|---|---|---|
| Residential | 1.8 | 1.5 | 4.1 | 2.4 | 2.8 | 4.2 | 2.8 | 4.91 |
| Commercial | 1.7 | 1.4 | 2.7 | 1.8 | 1.9 | 3.6 | 2.4 | 4.51 |
| Utility-scale | 2.0 | 1.4 | 2.2 | 1.4 | 1.5 | 2.9 | 1.9 | 3.31 |
| Source: IEA – Technology Roadmap: Solar Photovoltaic Energy report, September 2014'[14]: 15 1U.S figures are lower in DOE's Photovoltaic System Pricing Trends[70] | ||||||||
According to the International Renewable Energy Agency, a "sustained, dramatic decline" in utility-scale solar PV electricity cost driven by lower solar PV module and system costs continued in 2018, with global weighted average levelized cost of energy of solar PV falling to US$0.085 per kilowatt-hour, or 13% lower than projects commissioned the previous year, resulting in a decline from 2010 to 2018 of 77%.[73]
Technologies (1990–present)

There were significant advances in conventional crystalline silicon (c-Si) technology in the years leading up to 2017. The falling cost of the polysilicon since 2009, that followed after a period of severe shortage (see below) of silicon feedstock, pressure increased on manufacturers of commercial thin-film PV technologies, including amorphous thin-film silicon (a-Si), cadmium telluride (CdTe), and copper indium gallium diselenide (CIGS), led to the bankruptcy of several thin-film companies that had once been highly touted.[75] The sector faced price competition from Chinese crystalline silicon cell and module manufacturers, and some companies together with their patents were sold below cost.[76]
In 2013 thin-film technologies accounted for about 9 percent of worldwide deployment, while 91 percent was held by crystalline silicon (mono-Si and multi-Si). With 5 percent of the overall market, CdTe held more than half of the thin-film market, leaving 2 percent to each CIGS and amorphous silicon.[77]: 24–25
- Copper indium gallium selenide (CIGS) is the name of the semiconductor material on which the technology is based. One of the largest producers of CIGS photovoltaics in 2015 was the Japanese company Solar Frontier with a manufacturing capacity in the gigawatt-scale. Their CIS line technology included modules with conversion efficiencies of over 15%.[78] The company profited from the booming Japanese market and attempted to expand its international business. However, several prominent manufacturers could not keep up with the advances in conventional crystalline silicon technology. The company Solyndra ceased all business activity and filed for Chapter 11 bankruptcy in 2011, and Nanosolar, also a CIGS manufacturer, closed its doors in 2013. Although both companies produced CIGS solar cells, it has been pointed out, that the failure was not due to the technology but rather because of the companies themselves, using a flawed architecture, such as, for example, Solyndra's cylindrical substrates.[79]
- The U.S.-company First Solar, a leading manufacturer of CdTe, built several of the world's largest solar power stations, such as the Desert Sunlight Solar Farm and Topaz Solar Farm, both in the Californian desert with 550 MW capacity each, as well as the 102 MWAC Nyngan Solar Plant in Australia (the largest PV power station in the Southern Hemisphere at the time) commissioned in mid-2015.[80] The company was reported in 2013 to be successfully producing CdTe-panels with a steadily increasing efficiency and declining cost per watt.[81]: 18–19 CdTe was the lowest energy payback time of all mass-produced PV technologies, and could be as short as eight months in favorable locations.[77]: 31 The company Abound Solar, also a manufacturer of cadmium telluride modules, went bankrupt in 2012.[82]
- In 2012, ECD solar, once one of the world's leading manufacturer of amorphous silicon (a-Si) technology, filed for bankruptcy in Michigan, United States. Swiss OC Oerlikon divested its solar division that produced a-Si/μc-Si tandem cells to Tokyo Electron Limited.[83][84] Other companies that left the amorphous silicon thin-film market include DuPont, BP, Flexcell, Inventux, Pramac, Schuco, Sencera, EPV Solar,[85] NovaSolar (formerly OptiSolar)[86] and Suntech Power that stopped manufacturing a-Si modules in 2010 to focus on crystalline silicon solar panels. In 2013, Suntech filed for bankruptcy in China.[87][88]
Silicon shortage (2005–2008)
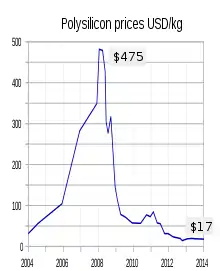
In the early 2000s, prices for polysilicon, the raw material for conventional solar cells, were as low as $30 per kilogram and silicon manufacturers had no incentive to expand production.
However, there was a severe silicon shortage in 2005, when governmental programmes caused a 75% increase in the deployment of solar PV in Europe. In addition, the demand for silicon from semiconductor manufacturers was growing. Since the amount of silicon needed for semiconductors makes up a much smaller portion of production costs, semiconductor manufacturers were able to outbid solar companies for the available silicon in the market.[89]
Initially, the incumbent polysilicon producers were slow to respond to rising demand for solar applications, because of their painful experience with over-investment in the past. Silicon prices sharply rose to about $80 per kilogram, and reached as much as $400/kg for long-term contracts and spot prices. In 2007, the constraints on silicon became so severe that the solar industry was forced to idle about a quarter of its cell and module manufacturing capacity—an estimated 777 MW of the then available production capacity. The shortage also provided silicon specialists with both the cash and an incentive to develop new technologies and several new producers entered the market. Early responses from the solar industry focused on improvements in the recycling of silicon. When this potential was exhausted, companies have been taking a harder look at alternatives to the conventional Siemens process.[90]
As it takes about three years to build a new polysilicon plant, the shortage continued until 2008. Prices for conventional solar cells remained constant or even rose slightly during the period of silicon shortage from 2005 to 2008. This is notably seen as a "shoulder" that sticks out in the Swanson's PV-learning curve and it was feared that a prolonged shortage could delay solar power becoming competitive with conventional energy prices without subsidies.
In the meantime the solar industry lowered the number of grams-per-watt by reducing wafer thickness and kerf loss, increasing yields in each manufacturing step, reducing module loss, and raising panel efficiency. Finally, the ramp up of polysilicon production alleviated worldwide markets from the scarcity of silicon in 2009 and subsequently lead to an overcapacity with sharply declining prices in the photovoltaic industry for the following years.
Solar overcapacity (2009–2013)
As the polysilicon industry had started to build additional large production capacities during the shortage period, prices dropped as low as $15 per kilogram forcing some producers to suspend production or exit the sector. Prices for silicon stabilized around $20 per kilogram and the booming solar PV market helped to reduce the enormous global overcapacity from 2009 onwards. However, overcapacity in the PV industry continued to persist. In 2013, global record deployment of 38 GW (updated EPIA figure[17]) was still much lower than China's annual production capacity of approximately 60 GW. Continued overcapacity was further reduced by significantly lowering solar module prices and, as a consequence, many manufacturers could no longer cover costs or remain competitive. As worldwide growth of PV deployment continued, the gap between overcapacity and global demand was expected in 2014 to close in the next few years.[92]
IEA-PVPS published in 2014 historical data for the worldwide utilization of solar PV module production capacity that showed a slow return to normalization in manufacture in the years leading up to 2014. The utilization rate is the ratio of production capacities versus actual production output for a given year. A low of 49% was reached in 2007 and reflected the peak of the silicon shortage that idled a significant share of the module production capacity. As of 2013, the utilization rate had recovered somewhat and increased to 63%.[91]: 47
Anti-dumping duties (2012–present)
After anti-dumping petition were filed and investigations carried out,[93] the United States imposed tariffs of 31 percent to 250 percent on solar products imported from China in 2012.[94] A year later, the EU also imposed definitive anti-dumping and anti-subsidy measures on imports of solar panels from China at an average of 47.7 percent for a two-year time span.[95]
Shortly thereafter, China, in turn, levied duties on U.S. polysilicon imports, the feedstock for the production of solar cells.[96] In January 2014, the Chinese Ministry of Commerce set its anti-dumping tariff on U.S. polysilicon producers, such as Hemlock Semiconductor Corporation to 57%, while other major polysilicon producing companies, such as German Wacker Chemie and Korean OCI were much less affected. All this has caused much controversy between proponents and opponents and was subject of debate.
History of deployment
.png.webp)
Deployment figures on a global, regional and nationwide scale are well documented since the early 1990s. While worldwide photovoltaic capacity grew continuously, deployment figures by country were much more dynamic, as they depended strongly on national policies. A number of organizations release comprehensive reports on PV deployment on a yearly basis. They include annual and cumulative deployed PV capacity, typically given in watt-peak, a break-down by markets, as well as in-depth analysis and forecasts about future trends.
| Year(a) | Name of PV power station | Country | Capacity MW |
|---|---|---|---|
| 1982 | Lugo | United States | 1 |
| 1985 | Carrisa Plain | United States | 5.6 |
| 2005 | Bavaria Solarpark (Mühlhausen) | Germany | 6.3 |
| 2006 | Erlasee Solar Park | Germany | 11.4 |
| 2008 | Olmedilla Photovoltaic Park | Spain | 60 |
| 2010 | Sarnia Photovoltaic Power Plant | Canada | 97 |
| 2011 | Huanghe Hydropower Golmud Solar Park | China | 200 |
| 2012 | Agua Caliente Solar Project | United States | 290 |
| 2014 | Topaz Solar Farm(b) | United States | 550 |
| 2015 | Longyangxia Dam Solar Park | China | 850 |
| 2016 | Tengger Desert Solar Park | China | 1547 |
| 2019 | Pavagada Solar Park | India | 2050 |
| 2020 | Bhadla Solar Park | India | 2245 |
| Also see list of photovoltaic power stations and list of noteworthy solar parks (a) year of final commissioning (b) capacity given in MWAC otherwise in MWDC | |||
Worldwide annual deployment

- 2018: 103,000 MW (20.4%)
- 2017: 95,000 MW (18.8%)
- 2016: 76,600 MW (15.2%)
- 2015: 50,909 MW (10.1%)
- 2014: 40,134 MW (8.0%)
- 2013: 38,352 MW (7.6%)
- 2012: 30,011 MW (5.9%)
- 2011: 30,133 MW (6.0%)
- 2010: 17,151 MW (3.4%)
- 2009: 7,340 MW (1.5%)
- 2008: 6,661 MW (1.3%)
- before: 9,183 MW (1.8%)
annual deployment since 2002 2022: 268 GW (estimate) [99]
Worldwide cumulative
The worldwide growth of solar PV capacity was an exponential curve between 1992 and 2017. Tables below show global cumulative nominal capacity by the end of each year in megawatts, and the year-to-year increase in percent. In 2014, the global capacity was expected to grow by 33 percent from 139 to 185 GW. This corresponded to an exponential growth rate of 29 percent or about 2.4 years for current worldwide PV capacity to double. Exponential growth rate: P(t) = P0ert, where P0 is 139 GW, growth-rate r 0.29 (results in doubling time t of 2.4 years).
The following table contains data from multiple different sources. For 1992–1995: compiled figures of 16 main markets (see section All time PV installations by country), for 1996–1999: BP-Statistical Review of world energy (Historical Data Workbook)[100] for 2000–2013: EPIA Global Outlook on Photovoltaics Report[17]: 17
| Year | CapacityA MWp |
Δ%B | Refs |
|---|---|---|---|
| 1991 | n.a. | — | C |
| 1992 | 105 | n.a. | C |
| 1993 | 130 | 24% | C |
| 1994 | 158 | 22% | C |
| 1995 | 192 | 22% | C |
| 1996 | 309 | 61% | [100] |
| 1997 | 422 | 37% | [100] |
| 1998 | 566 | 34% | [100] |
| 1999 | 807 | 43% | [100] |
| 2000 | 1,250 | 55% | [100] |
| Year | CapacityA MWp |
Δ%B | Refs |
|---|---|---|---|
| 2001 | 1,615 | 27% | [17] |
| 2002 | 2,069 | 28% | [17] |
| 2003 | 2,635 | 27% | [17] |
| 2004 | 3,723 | 41% | [17] |
| 2005 | 5,112 | 37% | [17] |
| 2006 | 6,660 | 30% | [17] |
| 2007 | 9,183 | 38% | [17] |
| 2008 | 15,844 | 73% | [17] |
| 2009 | 23,185 | 46% | [17] |
| 2010 | 40,336 | 74% | [17] |
| Year | CapacityA MWp |
Δ%B | Refs |
|---|---|---|---|
| 2011 | 70,469 | 75% | [17] |
| 2012 | 100,504 | 43% | [17] |
| 2013 | 138,856 | 38% | [17] |
| 2014 | 178,391 | 28% | [97] |
| 2015 | 221,988 | 24% | [101] |
| 2016 | 295,816 | 33% | [101] |
| 2017 | 388,550 | 31% | [101] |
| 2018 | 488,741 | 26% | [101] |
| 2019 | 586,421 | 20% | [101] |
| 2020 | 713,970 | 21% | [102] |
| Year | CapacityA MWp |
Δ%B | Refs |
|---|---|---|---|
| 2021 | 849,473 | 19% | [103] |
| 2022 | 1,053,115 | 19% |
Deployment by country
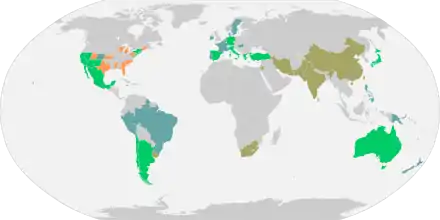
Reached grid-parity before 2014
Reached grid-parity after 2014
Reached grid-parity only for peak prices
U.S. states poised to reach grid-parity
Source: Deutsche Bank, as of February 2015
Number of countries with PV
capacities in the gigawatt-scale
2021 


2020 


2019 


2018 


2017 


2016 

2015 

2014 

.svg.png.webp)
2013 .svg.png.webp)


2012 


2011 .svg.png.webp)

2010 .svg.png.webp)


2009 
2008 

2004 

2022 2021 2020 2019 2018 2017 2016 2013 2011 2010
2021 [104]2017
IEA and other sources (1992-2015)
| Country | 1992 | 1993 | 1994 | 1995 | 1996 | 1997 | 1998 | 1999 | 2000 | 2001 | 2002 | 2003 | 2004 | 2005 | 2006 | 2007 | 2008 | 2009 | 2010 | 2011 | 2012 | 2013 | 2014 | 2015 |
|---|---|---|---|---|---|---|---|---|---|---|---|---|---|---|---|---|---|---|---|---|---|---|---|---|
| Algeria | 30 | 300 | ||||||||||||||||||||||
| Argentina | 4 | 12 | ||||||||||||||||||||||
| Australia | 7.3 | 8.9 | 10.7 | 12.7 | 15.9 | 18.7 | 22.5 | 25.3 | 29.2 | 33.6 | 39.1 | 45.6 | 52.3 | 60.6 | 70.3 | 82.5 | 105 | 188 | 571 | 1377 | 2415 | 3226 | 4136 | 5109 |
| Austria | 0.6 | 0.8 | 1.1 | 1.4 | 1.7 | 2.2 | 2.9 | 3.7 | 4.9 | 6.1 | 10.3 | 16.8 | 21.1 | 24.0 | 25.6 | 28.7 | 32.4 | 52.6 | 95.5 | 187 | 363 | 626 | 766 | 935 |
| Belgium | 23.7 | 108 | 649 | 1067 | 2088 | 2722 | 3009 | 3074 | 3228 | |||||||||||||||
| Brazil | 5 | D17 | D32 | F54 | ||||||||||||||||||||
| Bulgaria | 5.7 | 35 | 141 | 1010 | 1020 | 1020 | 1021 | |||||||||||||||||
| Canada | 1.0 | 1.1 | 1.5 | 1.9 | 2.6 | 3.4 | 4.5 | 5.8 | 7.2 | 8.8 | 10.0 | 11.8 | 13.9 | 16.8 | 20.5 | 25.8 | 32.7 | 94.6 | 281 | 558 | 766 | 1211 | 1710 | 2579 |
| Chile | C<1 | C2 | 3 | 368 | 848 | |||||||||||||||||||
| China | 19 | 23.5 | 42 | 52 | 62 | 70 | 80 | 100 | 140 | 300 | 800 | 3300 | 6800 | 19720 | 28199 | 43530 | ||||||||
| Croatia | 0.2 | 20 | 34 | 45 | ||||||||||||||||||||
| Cyprus | 3.3 | 6.2 | 9 | 17 | 32 | 65 | 70 | |||||||||||||||||
| Czech | 463.3 | 1952 | 1959 | 2087 | 2175 | 2134 | 2083 | |||||||||||||||||
| Denmark | 0.1 | 0.1 | 0.1 | 0.2 | 0.4 | 0.5 | 1.1 | 1.5 | 1.5 | 1.6 | 1.9 | 2.3 | 2.7 | 2.9 | 3.1 | 3.2 | 4.6 | 7.1 | 16.7 | 408 | 563 | 603 | 783 | |
| Estonia | 0.05 | 0.08 | 0.2 | 0.2 | 0.2 | 0.1 | 4.1 | |||||||||||||||||
| Finland | 0.1 | 1 | 11 | 11 | 11.2 | 14.7 | ||||||||||||||||||
| France | 1.8 | 2.1 | 2.4 | 2.9 | 4.4 | 6.1 | 7.6 | 9.1 | 11.3 | 13.9 | 17.2 | 21.1 | 26.0 | 33.0 | 36.5 | 74.5 | 179 | 369 | 1204 | 2974 | 4090 | 4733 | 5660 | 6589 |
| Germany | 2.9 | 4.3 | 5.6 | 6.7 | 10.3 | 16.5 | 21.9 | 30.2 | 89.4 | 207 | 324 | 473 | 1139 | 2072 | 2918 | 4195 | 6153 | 9959 | 17372 | 24858 | 32462 | 35766 | 38200 | 39763 |
| Greece | 55 | 205 | 624 | 1536 | 2579 | 2595 | 2613 | |||||||||||||||||
| Guatemala | n/a | F+6 | ||||||||||||||||||||||
| Honduras | n/a | F+5 | 389 | |||||||||||||||||||||
| Hungary | 0.65 | 1.75 | 4 | 12 | 35 | 78 | 137 | |||||||||||||||||
| India | 161 | 461 | 1205 | 2320 | 2936 | 5050 | ||||||||||||||||||
| Ireland | 0.4 | 0.6 | 0.7 | 0.7 | 0.9 | 1.0 | 1.1 | 2.1 | ||||||||||||||||
| Israel | 0.9 | 1.0 | 1.3 | 1.8 | 3.0 | 24.5 | 69.9 | 190 | 237 | 481 | 731 | 886 | ||||||||||||
| Italy | 8.5 | 12.1 | 14.1 | 15.8 | 16.0 | 16.7 | 17.7 | 18.5 | 19.0 | 20.0 | 22.0 | 26.0 | 30.7 | 37.5 | 50.0 | 120 | 458 | 1181 | 3502 | 12809 | 16454 | 18074 | 18460 | 18924 |
| Japan | 19.0 | 24.3 | 31.2 | 43.4 | 59.6 | 91.3 | 133 | 209 | 330 | 453 | 637 | 860 | 1132 | 1422 | 1709 | 1919 | 2144 | 2627 | 3618 | 4914 | 6632 | 13599 | 23300 | 34151 |
| Latvia | 0 | 0.2 | 0.2 | 0.2 | 1.5 | 1.5 | ||||||||||||||||||
| Lithuania | 0.07 | 0.2 | 0.3 | 6.2 | 68 | 68 | 73 | |||||||||||||||||
| Luxembourg | 26.4 | 27.3 | 30 | A30 | A30 | A45 | 125 | |||||||||||||||||
| Malaysia | 5.5 | 7.0 | 8.8 | 11.1 | 12.6 | 13.5 | 35 | 73 | 160 | 231 | ||||||||||||||
| Malta | 1.53 | 1.67 | 12 | 16 | 23 | 54 | 73 | |||||||||||||||||
| Mexico | 5.4 | 7.1 | 8.8 | 9.2 | 10.0 | 11.0 | 12.0 | 12.9 | 13.9 | G13.9 | G13.9 | G13.9 | G15.9 | G16.9 | G17.9 | G18.9 | G19.9 | G24.9 | G38.9 | G29.9 | G34.9 | G65.9 | G114.1 | G170.1 |
| Netherlands | 0.1 | 0.1 | 0.3 | 0.7 | 1.0 | 1.0 | 5.3 | 8.5 | 16.2 | 21.7 | 39.7 | 43.4 | 45.4 | 47.5 | 48.6 | 52.8 | 63.9 | 84.7 | 143 | I365 | I739 | I1048 | I1405 | |
| Norway | B6.4 | B6.6 | B6.9 | B7.3 | B7.7 | B8.0 | B8.3 | B8.7 | B9.1 | B9.5 | B10 | B11 | 13 | 15.3 | ||||||||||
| Pakistan | ? | 400 | 1000 | |||||||||||||||||||||
| Peru | 0 | D22 | n/a | n/a | ||||||||||||||||||||
| Philippines | ? | 33 | 155 | |||||||||||||||||||||
| Poland | 1.38 | 1.75 | 3 | 7 | 7 | 24 | 87 | |||||||||||||||||
| Portugal | 0.2 | 0.2 | 0.3 | 0.3 | 0.4 | 0.5 | 0.6 | 0.9 | 1.1 | 1.3 | 1.7 | 2.0 | 2.0 | 2.0 | 4.0 | 15 | 56 | 99 | 135 | 169 | 228 | 281 | 391 | 460 |
| Romania | 0.64 | 1.94 | 4 | 51 | 1151 | 1219 | 1325 | |||||||||||||||||
| Slovakia | 0.19 | 148 | 508 | 523 | 524 | 533 | 591 | |||||||||||||||||
| Slovenia | 9.0 | 35 | 81 | 201 | 212 | 256 | 257 | |||||||||||||||||
| South Africa | 1 | 30 | 122 | 922 | 1120 | |||||||||||||||||||
| South Korea | 1.5 | 1.6 | 1.7 | 1.8 | 2.1 | 2.5 | 3.0 | 3.5 | 4.0 | 4.7 | 10.0 | 11.0 | 13.8 | 19.2 | 41.8 | 87.2 | 363 | 530 | 656 | 735 | 1030 | 1475 | 2384 | 3493 |
| Spain | 1.0 | 1.0 | 1.0 | 1.0 | 1.0 | 2.0 | 2.0 | 4.0 | 7.0 | 12.0 | 23.0 | 48 | 145 | 693 | H3421 | H3438 | H3859 | H4322 | H4603 | H4766 | H4872 | H4921 | ||
| Sweden | 0.8 | 1.0 | 1.3 | 1.6 | 1.8 | 2.1 | 2.4 | 2.6 | 2.8 | 3.0 | 3.3 | 3.6 | 3.9 | 4.2 | 4.8 | 6.2 | 7.9 | 8.8 | 11 | 11 | 24 | 43 | 79 | 130 |
| Switzerland | 4.7 | 5.8 | 6.7 | 7.5 | 8.4 | 9.7 | 11.5 | 13.4 | 15.3 | 17.6 | 19.5 | 21.0 | 23.1 | 27.1 | 29.7 | 36.2 | 47.9 | 73.6 | 111 | 211 | 437 | 756 | 1076 | 1394 |
| Taiwan | 32 | 102 | 206 | 376 | 776 | 1010 | ||||||||||||||||||
| Thailand | 2.9 | 4.2 | 10.8 | 23.9 | 30.5 | 32.5 | 33.4 | 43.2 | 49.2 | 243 | 388 | 824 | 1299 | 1420 | ||||||||||
| Turkey | 0.2 | 0.3 | 0.4 | 0.6 | 0.9 | 1.3 | 1.8 | 2.3 | 2.8 | 3.3 | 4.0 | 5.0 | 6 | 7 | 8.5 | 18 | 58 | 266 | ||||||
| Ukraine | 3 | 191 | 326 | 616 | 819 | 432 | ||||||||||||||||||
| UK | 0.2 | 0.3 | 0.3 | 0.4 | 0.4 | 0.6 | 0.7 | 1.1 | 1.9 | 2.7 | 4.1 | 5.9 | 8.2 | 10.9 | 14.3 | 18.1 | 22.5 | 29.6 | 77 | 904 | E1901 | E3377 | 5104 | 8917 |
| USA | 43.5 | 50.3 | 57.8 | 66.8 | 76.5 | 88.2 | 100 | 117 | 139 | 168 | 212 | 275 | 376 | 479 | 624 | 831 | 1169 | 1256 | 2528 | 4383 | 7272 | 12079 | 18280 | 25600 |
| References | [105] | [106] | [107] | [108][109] | [110][111] | [17][91] | [112][113] | [114][115][116] | ||||||||||||||||
| Year | 1992 | 1993 | 1994 | 1995 | 1996 | 1997 | 1998 | 1999 | 2000 | 2001 | 2002 | 2003 | 2004 | 2005 | 2006 | 2007 | 2008 | 2009 | 2010 | 2011 | 2012 | 2013 | 2014 | 2015 |
Notes:
| ||||||||||||||||||||||||
IRENA (2000-2020)
| ISO_A3 | Country/Region | 2000 | 2001 | 2002 | 2003 | 2004 | 2005 | 2006 | 2007 | 2008 | 2009 | 2010 | 2011 | 2012 | 2013 | 2014 | 2015 | 2016 | 2017 | 2018 | 2019 | 2020 |
|---|---|---|---|---|---|---|---|---|---|---|---|---|---|---|---|---|---|---|---|---|---|---|
| AFG | Afghanistan | 0 | 0 | 0 | 0 | 0 | 0 | 0 | 0 | 0 | 0 | 0.1 | 0.1 | 16.1 | 16.8 | 18.4 | 18.9 | 20.2 | 22 | 21.6 | 31.1 | 30.5 |
| ALB | Albania | 0 | 0.1 | 0.2 | 0.2 | 0.2 | 0.2 | 0.2 | 0.2 | 0.2 | 0.3 | 0.4 | 0.6 | 0.7 | 0.8 | 0.9 | 1.1 | 1 | 1 | 1 | 14 | 16.9 |
| DZA | Algeria | 0 | 0 | 0 | 0 | 0 | 0 | 0 | 0 | 0 | 0 | 0 | 0 | 0 | 0 | 1.1 | 49.1 | 219 | 400 | 423 | 423 | 423 |
| ASM | American Samoa | 0 | 0 | 0 | 0 | 0 | 0 | 0 | 0 | 0 | 0 | 0 | 0 | 2.4 | 2.4 | 2.4 | 2.4 | 3.8 | 4.2 | 5.1 | 5.1 | 5.1 |
| AND | Andorra | 0 | 0 | 0 | 0 | 0 | 0 | 0 | 0 | 0 | 0 | 0 | 0 | 0 | 0 | 0.2 | 0.2 | 0.2 | 0.5 | 1.1 | 2 | 2.9 |
| AGO | Angola | 0 | 0 | 0.2 | 0.2 | 0.4 | 0.6 | 0.8 | 2.7 | 4.8 | 5.3 | 7.1 | 7.7 | 9.6 | 10.8 | 12 | 12.9 | 13.4 | 13.4 | 13.4 | 13.4 | 13.4 |
| AIA | Anguilla | 0 | 0 | 0 | 0 | 0 | 0 | 0 | 0 | 0 | 0 | 0 | 0 | 0.1 | 0.1 | 1.1 | 1.1 | 2.1 | 2.1 | 1.1 | 1.5 | 1.5 |
| ATG | Antigua and Barbuda | 0 | 0 | 0 | 0 | 0 | 0 | 0 | 0 | 0 | 0.1 | 0.1 | 0.3 | 0.3 | 0.4 | 0.4 | 3.4 | 3.5 | 3.9 | 8.3 | 8.3 | 12.5 |
| ARG | Argentina | 0 | 0 | 0 | 0 | 0 | 0 | 0 | 0 | 0 | 0 | 0 | 1.2 | 6.2 | 8.3 | 8.3 | 8.6 | 8.8 | 8.8 | 191 | 442 | 761 |
| ARM | Armenia | 0 | 0 | 0 | 0 | 0 | 0 | 0 | 0 | 0 | 0 | 0 | 0 | 0 | 0 | 0 | 0 | 1 | 2.4 | 17.3 | 50 | 95 |
| ABW | Aruba | 0 | 0 | 0 | 0 | 0 | 0 | 0 | 0 | 0 | 0 | 0.1 | 0.3 | 1 | 1.6 | 4.9 | 6.1 | 6.1 | 6.1 | 6.1 | 6.1 | 6.1 |
| AUS | Australia | 25 | 29 | 34 | 39 | 46 | 52 | 61 | 70 | 82 | 329 | 1,088 | 2,470 | 3,796 | 4,565 | 5,284 | 5,943 | 6,686 | 7,352 | 8,623 | 12,967 | 17,342 |
| AUT | Austria | 5 | 7 | 9 | 23 | 27 | 21 | 22.4 | 24.2 | 30.1 | 48.9 | 88.8 | 174 | 337 | 626 | 785 | 937 | 1,096 | 1,269 | 1,455 | 1,702 | 2,220 |
| AZE | Azerbaijan | 0 | 0 | 0 | 0 | 0 | 0 | 0 | 0.1 | 0.1 | 0.1 | 0.3 | 1 | 1 | 1 | 2.4 | 4.8 | 24.9 | 28.4 | 34.9 | 35.4 | 35.4 |
| BHS | Bahamas (the) | 0 | 0 | 0 | 0 | 0 | 0 | 0 | 0.1 | 0.1 | 0.2 | 0.3 | 0.4 | 0.6 | 0.6 | 1.3 | 1.3 | 1.5 | 1.4 | 1.4 | 2.3 | 2.2 |
| BHR | Bahrain | 0 | 0 | 0 | 0 | 0 | 0 | 0 | 0 | 0 | 0 | 0 | 0 | 0.5 | 0.5 | 5 | 5 | 6 | 6 | 6.3 | 9.3 | 9.8 |
| BGD | Bangladesh | 0 | 0 | 0 | 0.6 | 1.4 | 2.5 | 4 | 6.6 | 11.1 | 18.3 | 32.3 | 42.6 | 66.1 | 94 | 119 | 145 | 161 | 185 | 201 | 239 | 276 |
| BRB | Barbados | 0 | 0.1 | 0.1 | 0.1 | 0.1 | 0.2 | 0.2 | 0.6 | 0.6 | 0.8 | 1 | 1.3 | 1.5 | 1.7 | 6.5 | 9 | 20 | 21 | 22 | 35 | 50 |
| BLR | Belarus | 0 | 0 | 0 | 0 | 0 | 0 | 0 | 0 | 0 | 0 | 0 | 0 | 0 | 0 | 4 | 6 | 47 | 80 | 154 | 154 | 160 |
| BEL | Belgium | 0 | 0 | 1 | 1 | 1 | 2 | 2 | 20 | 62 | 386 | 1,007 | 1,979 | 2,647 | 2,902 | 3,015 | 3,132 | 3,329 | 3,621 | 4,000 | 4,637 | 5,646 |
| BLZ | Belize | 0 | 0.1 | 0.1 | 0.1 | 0.2 | 0.3 | 0.3 | 0.4 | 0.5 | 0.6 | 0.7 | 0.8 | 1.9 | 1.9 | 2.6 | 3.9 | 3.9 | 3.9 | 4.2 | 6.3 | 6.6 |
| BEN | Benin | 0 | 0 | 0 | 0 | 0 | 0 | 0 | 0 | 0 | 0 | 0 | 0 | 0 | 0 | 0.2 | 1.2 | 2.9 | 2.9 | 2.9 | 2.9 | 2.9 |
| BES Islands | 0 | 0 | 0 | 0 | 0 | 0 | 0 | 0 | 0 | 0 | 0 | 0 | 0 | 0 | 0 | 0.3 | 2.2 | 4.5 | 5.6 | 6.6 | 6.6 | |
| BTN | Bhutan | 0 | 0 | 0 | 0 | 0 | 0.1 | 0.3 | 0.3 | 0.3 | 0.3 | 0.3 | 0.3 | 0.3 | 0.3 | 0.3 | 0.3 | 0.3 | 0.3 | 0.3 | 0.3 | 0.3 |
| BOL | Bolivia (Plurinational State of) | 0.3 | 0.4 | 0.5 | 0.7 | 0.8 | 0.8 | 1.1 | 1.4 | 2.4 | 2.8 | 3 | 3.4 | 4.1 | 5.5 | 5.5 | 5.5 | 5.5 | 7.5 | 69.9 | 120 | 120 |
| BIH | Bosnia and Herzegovina | 0 | 0 | 0 | 0.1 | 0.2 | 0.3 | 0.3 | 0.3 | 0.3 | 0.3 | 0.3 | 0.3 | 0.3 | 1.3 | 7.2 | 8.2 | 14.1 | 16 | 18.2 | 22.4 | 34.9 |
| BWA | Botswana | 0 | 0 | 0 | 0 | 0 | 0 | 0 | 0 | 0 | 0 | 0.1 | 0.2 | 1.6 | 1.7 | 1.9 | 2.2 | 3.3 | 3.4 | 3.9 | 6.1 | 6.1 |
| VGB | Virgin Islands (British) | 0 | 0 | 0 | 0 | 0 | 0 | 0 | 0 | 0 | 0 | 0.1 | 0.1 | 0.1 | 0.1 | 0.1 | 0.2 | 0.2 | 0.2 | 0.2 | 0.2 | 0.2 |
| BRA | Brazil | 0 | 0 | 0 | 0.7 | 0.7 | 0.7 | 0.7 | 0.7 | 0.8 | 0.8 | 0.9 | 6.1 | 6.6 | 12.5 | 20.7 | 45.6 | 128 | 1,207 | 2,435 | 4,613 | 7,879 |
| BRN | Brunei Darussalam | 0 | 0 | 0 | 0 | 0 | 0 | 0 | 0 | 0 | 0 | 1.2 | 1.2 | 1.2 | 1.2 | 1.2 | 1.2 | 1.2 | 1.2 | 1.2 | 1.2 | 1.4 |
| BGR | Bulgaria | 0 | 0 | 0 | 0 | 0 | 0 | 0 | 0 | 0.1 | 2 | 25 | 154 | 1,013 | 1,020 | 1,026 | 1,029 | 1,028 | 1,036 | 1,033 | 1,048 | 1,073 |
| BFA | Burkina Faso | 0.5 | 0.5 | 0.5 | 0.7 | 1.1 | 1.2 | 1.2 | 1.6 | 2.3 | 3 | 3.6 | 5.8 | 5.8 | 6.3 | 7 | 8 | 10 | 46.8 | 61.8 | 62.4 | 62.4 |
| BDI | Burundi | 0 | 0 | 0 | 0 | 0 | 0.1 | 0.2 | 0.3 | 0.4 | 0.4 | 0.6 | 0.8 | 1.6 | 2.6 | 2.8 | 3.1 | 4.1 | 5.1 | 5.1 | 5.1 | 5.1 |
| CPV | Cabo Verde | 0 | 0 | 0 | 0 | 0 | 0 | 0 | 0 | 0 | 0 | 5.5 | 5.5 | 5.6 | 5.7 | 5.8 | 6.1 | 6.2 | 6.2 | 7.5 | 7.6 | 7.6 |
| KHM | Cambodia | 0.1 | 0.2 | 0.3 | 0.3 | 0.4 | 0.5 | 0.7 | 1.6 | 1.9 | 2.1 | 2.2 | 3.9 | 4.7 | 5.9 | 9.2 | 12.2 | 18.4 | 29.4 | 28.8 | 124 | 208 |
| CMR | Cameroon | 0 | 0 | 0 | 0.1 | 0.1 | 0.1 | 0.1 | 0.2 | 0.2 | 0.5 | 1 | 2.4 | 2.8 | 3.6 | 5.6 | 7.4 | 9 | 11.6 | 14.2 | 14.2 | 14.3 |
| CAN | Canada | 7 | 9 | 10 | 12 | 14 | 18 | 22 | 29 | 38 | 107 | 249 | 628 | 766 | 1,210 | 1,843 | 2,519 | 2,665 | 2,932 | 3,095 | 3,327 | 3,342 |
| CYM | Cayman Islands (the) | 0 | 0 | 0 | 0 | 0 | 0 | 0 | 0 | 0 | 0 | 0 | 0 | 0 | 0 | 0 | 0 | 2.8 | 8.8 | 9.9 | 11.1 | 12.7 |
| CAF | Central African Republic (the) | 0 | 0 | 0 | 0 | 0 | 0.1 | 0.1 | 0.1 | 0.1 | 0.1 | 0.1 | 0.2 | 0.3 | 0.3 | 0.3 | 0.3 | 0.3 | 0.3 | 0.3 | 0.3 | 0.3 |
| TCD | Chad | 0 | 0 | 0 | 0 | 0 | 0 | 0 | 0 | 0 | 0 | 0 | 0 | 0 | 0.1 | 0.1 | 0.2 | 0.2 | 0.2 | 0.2 | 0.2 | 0.2 |
| CHL | Chile | 0 | 0 | 0 | 0 | 0 | 0 | 0 | 0 | 0 | 0 | 0 | 0 | 2 | 15 | 221 | 576 | 1,125 | 1,809 | 2,137 | 2,555 | 3,106 |
| CHN | China | 33.5 | 38 | 56.5 | 66.6 | 76.6 | 141 | 160 | 199 | 253 | 415 | 1,022 | 3,108 | 6,718 | 17,748 | 28,388 | 43,538 | 77,788 | 130,801 | 175,016 | 204,575 | 253,834 |
| TWN | Taiwan | 0.1 | 0.2 | 0.3 | 0.5 | 0.6 | 1 | 1.4 | 2.4 | 5.6 | 9.5 | 34.6 | 130 | 231 | 410 | 636 | 884 | 1,245 | 1,768 | 2,738 | 4,150 | 5,817 |
| COL | Colombia | 0.6 | 1 | 1 | 1.1 | 1.1 | 1.1 | 1.2 | 1.2 | 1.2 | 1.3 | 1.3 | 1.3 | 1.3 | 1.4 | 1.4 | 1.5 | 1.5 | 11.3 | 88.4 | 92.4 | 110 |
| COD | Congo (the Democratic Republic of the) | 0 | 0 | 0 | 0 | 0 | 0 | 0 | 0 | 0 | 0 | 0 | 0 | 0.1 | 0.4 | 0.6 | 0.7 | 3.2 | 5.2 | 19.9 | 19.9 | 19.9 |
| COG | Congo (the) | 0 | 0 | 0 | 0 | 0 | 0 | 0 | 0 | 0 | 0 | 0 | 0.1 | 0.1 | 0.2 | 0.5 | 0.5 | 0.5 | 0.6 | 0.7 | 0.7 | 0.7 |
| COK | Cook Islands (the) | 0 | 0 | 0 | 0 | 0 | 0 | 0 | 0 | 0 | 0 | 0 | 0 | 0 | 0.7 | 1.7 | 3.2 | 4.1 | 4.1 | 6 | 7.3 | 7.3 |
| CRI | Costa Rica | 0.2 | 0.6 | 1.1 | 1.7 | 2 | 2.6 | 3.2 | 3.8 | 4.6 | 5 | 6.2 | 6.8 | 9.9 | 12.7 | 16.7 | 22.5 | 23.6 | 28 | 28 | 48.4 | 56.8 |
| CIV | Côte d'Ivoire | 0 | 0.1 | 0.1 | 0.1 | 0.1 | 0.2 | 0.2 | 0.4 | 1.1 | 1.4 | 1.6 | 1.7 | 2 | 2.9 | 3.8 | 5.1 | 5.1 | 8.3 | 13.1 | 13.1 | 13.1 |
| HRV | Croatia | 0 | 0 | 0 | 0 | 0 | 0 | 0 | 0 | 0 | 0.3 | 0.3 | 0.3 | 4 | 19 | 33 | 47.8 | 55.8 | 60 | 67.7 | 84.8 | 84.8 |
| CUB | Cuba | 0 | 0 | 0 | 0 | 0 | 0 | 0 | 0 | 0 | 0 | 0 | 0 | 0.6 | 11 | 22 | 23.8 | 37 | 65.5 | 128 | 159 | 163 |
| CUW | Curaçao | 0 | 0 | 0 | 0 | 0 | 0 | 0 | 0 | 0 | 0 | 0 | 0 | 0.1 | 3.1 | 7.7 | 10.1 | 11.1 | 11.1 | 11.9 | 11.9 | 11.9 |
| CYP | Cyprus | 0 | 0 | 0 | 0 | 1 | 1 | 1 | 1 | 2 | 4 | 7 | 10 | 17 | 35 | 64 | 76 | 84 | 110 | 118 | 151 | 200 |
| CZE | Czechia | 0.1 | 0.1 | 0.2 | 0.3 | 0.4 | 0.6 | 0.8 | 4 | 39.5 | 465 | 1,727 | 1,913 | 2,022 | 2,064 | 2,067 | 2,075 | 2,068 | 2,070 | 2,075 | 2,086 | 2,073 |
| DNK | Denmark | 1 | 1 | 2 | 2 | 2 | 3 | 3 | 3 | 3 | 5 | 7 | 17 | 402 | 571 | 607 | 782 | 851 | 906 | 998 | 1,080 | 1,300 |
| DJI | Djibouti | 0 | 0 | 0 | 0 | 0 | 0 | 0 | 0 | 0 | 0 | 0 | 0 | 0.3 | 0.3 | 0.3 | 0.3 | 0.4 | 0.4 | 0.4 | 0.4 | 0.4 |
| DMA | Dominica | 0.1 | 0.1 | 0.1 | 0.1 | 0.1 | 0.1 | 0.1 | 0.2 | 0.2 | 0.2 | 0.2 | 0.2 | 0.2 | 0.2 | 0.2 | 0.2 | 0.6 | 0.6 | 0.3 | 0.3 | 0.3 |
| DOM | Dominican Republic (the) | 0 | 0 | 0 | 0 | 0 | 0 | 0 | 0 | 0 | 0 | 0 | 0 | 1.6 | 8.9 | 15.3 | 25.8 | 71.1 | 103 | 203 | 196 | 267 |
| ECU | Ecuador | 0 | 0 | 0 | 0 | 0 | 0 | 0 | 0 | 0 | 0 | 0 | 0 | 0.1 | 3.9 | 26.4 | 25.5 | 25.6 | 25.6 | 26.7 | 27.6 | 27.6 |
| EGY | Egypt | 0.1 | 0.5 | 0.6 | 0.6 | 0.6 | 0.6 | 0.6 | 0.7 | 0.9 | 1.3 | 15 | 15 | 15 | 15 | 15 | 25 | 39 | 160 | 744 | 1,627 | 1,659 |
| SLV | El Salvador | 0 | 0 | 0 | 0 | 0 | 0 | 0 | 0 | 0 | 0 | 0 | 0 | 0 | 12.5 | 12.5 | 23.6 | 24.8 | 121 | 198 | 403 | 429 |
| GNQ | Equatorial Guinea | 0 | 0 | 0 | 0 | 0 | 0 | 0 | 0 | 0 | 0 | 0 | 0 | 0 | 0 | 0 | 0 | 0 | 0 | 0 | 0 | 0.1 |
| ERI | Eritrea | 0 | 0 | 0 | 0 | 0 | 0 | 0 | 0 | 0 | 0 | 0 | 0 | 0 | 0 | 7.9 | 7.9 | 8.2 | 10.2 | 17.7 | 20 | 22.2 |
| EST | Estonia | 0 | 0 | 0 | 0 | 0 | 0 | 0 | 0 | 0 | 0.1 | 0.1 | 0.2 | 0.4 | 1.5 | 3.3 | 6.5 | 10 | 15 | 31.9 | 121 | 130 |
| SWZ | Eswatini | 0 | 0 | 0 | 0 | 0 | 0.1 | 0.2 | 0.2 | 0.2 | 0.3 | 0.6 | 0.7 | 0.8 | 0.8 | 0.8 | 0.8 | 0.9 | 0.9 | 0.9 | 0.9 | 0.9 |
| ETH | Ethiopia | 0 | 0 | 0 | 0 | 0 | 0 | 0 | 0 | 0 | 0 | 0 | 0.3 | 1.1 | 3.3 | 9.1 | 9.9 | 14 | 12.5 | 12.3 | 12.3 | 20.2 |
| E28 | European Union (28) | 178 | 276 | 360 | 596 | 1 305 | 2 281 | 3 235 | 5 006 | 10 420 | 16 816 | 30 148 | 53 393 | 71 206 | 80 659 | 87 190 | 95 370 | 101 490 | 107 073 | 115 223 | 131 813 | 150 502 |
| FLK | Falkland Islands (the) [Malvinas] | 0 | 0 | 0 | 0 | 0 | 0 | 0 | 0 | 0 | 0 | 0 | 0 | 0 | 0 | 0 | 0.1 | 0.1 | 0.1 | 0.1 | 0.1 | 0.1 |
| FRO | Faroe Islands (the) | 0 | 0 | 0 | 0 | 0 | 0 | 0 | 0 | 0 | 0 | 0 | 0 | 0 | 0 | 0 | 0 | 0 | 0 | 0 | 0.3 | 0.3 |
| FJI | Fiji | 0.1 | 0.1 | 0.1 | 0.1 | 0 | 0.1 | 0.1 | 0.1 | 0.2 | 0.2 | 0.3 | 0.3 | 0.9 | 1.4 | 1.9 | 3.3 | 5.3 | 7.1 | 9.5 | 9.5 | 9.7 |
| FIN | Finland | 2 | 3 | 3 | 3 | 4 | 4 | 5 | 5 | 6 | 6 | 7 | 7 | 8 | 9 | 11 | 17 | 39 | 82 | 140 | 222 | 391 |
| GUF | French Guiana | 0.1 | 0.1 | 0.1 | 0.1 | 0.1 | 0.2 | 0.2 | 0.2 | 0.6 | 2.5 | 23.2 | 35.9 | 36.3 | 36.6 | 36.7 | 46.5 | 46.5 | 46.6 | 46.7 | 46.7 | 54.9 |
| PYF | French Polynesia | 0.5 | 0.7 | 0.8 | 1 | 1.2 | 1.5 | 1.8 | 1.9 | 2.1 | 2.4 | 2.9 | 11 | 13.5 | 16.9 | 24.6 | 27.9 | 31.6 | 35.2 | 37.4 | 41 | 41 |
| FRA | France | 7 | 7 | 8 | 9 | 11 | 13 | 15 | 26 | 80 | 277 | 1,044 | 3,004 | 4,359 | 5,277 | 6,034 | 7,138 | 7,702 | 8,610 | 9,691 | 10,795 | 11,724 |
| GAB | Gabon | 0 | 0 | 0.1 | 0.1 | 0.1 | 0.1 | 0.2 | 0.2 | 0.4 | 1.4 | 1.4 | 1.4 | 1.4 | 1.4 | 1.4 | 1.4 | 1.4 | 1.4 | 1.4 | 1.4 | 1.4 |
| GMB | Gambia (the) | 0 | 0 | 0.1 | 0.2 | 0.4 | 0.6 | 0.7 | 1.2 | 1.4 | 1.6 | 1.8 | 1.9 | 2 | 2 | 2.1 | 2.2 | 2.2 | 2.2 | 2.2 | 2.2 | 2.2 |
| GEO | Georgia | 0 | 0 | 0 | 0 | 0 | 0 | 0 | 0 | 0 | 0 | 0 | 0 | 0 | 0 | 0 | 0 | 0.3 | 0.3 | 0.3 | 0.7 | 0.7 |
| DEU | Germany | 114 | 195 | 260 | 435 | 1,105 | 2,056 | 2,899 | 4,170 | 6,120 | 10,564 | 18,004 | 25,914 | 34,075 | 36,708 | 37,898 | 39,222 | 40,677 | 42,291 | 45,156 | 49,045 | 53,781 |
| GHA | Ghana | 0 | 0 | 0 | 0 | 0 | 0 | 0 | 0 | 0 | 0 | 0 | 0 | 0 | 3.5 | 5.7 | 31.4 | 37.9 | 47.1 | 80.9 | 87.7 | 94.2 |
| GRC | Greece | 0 | 1 | 1 | 1 | 1 | 1 | 5 | 9 | 12 | 46 | 202 | 612 | 1,536 | 2,579 | 2,596 | 2,604 | 2,604 | 2,606 | 2,652 | 2,834 | 3,247 |
| GRL | Greenland | 0 | 0 | 0 | 0 | 0 | 0 | 0 | 0 | 0 | 0 | 0 | 0 | 0 | 0 | 0 | 0 | 0 | 0 | 0.1 | 0.1 | 0.1 |
| GRD | Grenada | 0 | 0 | 0 | 0 | 0 | 0 | 0 | 0 | 0.1 | 0.1 | 0.2 | 0.3 | 0.3 | 0.5 | 0.7 | 1 | 2.2 | 2.3 | 2.7 | 3.3 | 3.3 |
| GLP | Guadeloupe | 0 | 0 | 0 | 0 | 0 | 0.4 | 1.2 | 2.5 | 3.7 | 10.9 | 22.4 | 28.5 | 60 | 66.6 | 66.6 | 67.1 | 68 | 70 | 70 | 81 | 85.4 |
| GUM | Guam | 0 | 0 | 0 | 0 | 0 | 0 | 0 | 0 | 0 | 0 | 0.1 | 0.1 | 0.3 | 0.8 | 1.4 | 32 | 34.7 | 34.7 | 34.8 | 34.8 | 34.8 |
| GTM | Guatemala | 0.1 | 0.1 | 0.2 | 0.2 | 0.2 | 0.2 | 0.3 | 0.3 | 0.4 | 0.5 | 0.6 | 0.8 | 1.5 | 2.6 | 10.4 | 93.3 | 93.3 | 99.3 | 101 | 101 | 101 |
| GIN | Guinea | 0 | 0 | 0 | 0 | 0 | 0 | 0 | 0 | 0 | 0.6 | 0.6 | 0.6 | 0.6 | 3.4 | 3.4 | 13.3 | 13.3 | 13.3 | 13.4 | 13.4 | 13.4 |
| GNB | Guinea-Bissau | 0 | 0 | 0 | 0 | 0 | 0 | 0 | 0 | 0 | 0 | 0 | 0 | 0 | 0 | 0 | 0.3 | 0.3 | 0.3 | 1.2 | 1.2 | 1.2 |
| GUY | Guyana | 0 | 0 | 0 | 0 | 0 | 0 | 0 | 0 | 0.1 | 0.1 | 0.2 | 0.9 | 1 | 1 | 1.1 | 1.5 | 2 | 3.5 | 6.3 | 8.4 | 8.4 |
| HTI | Haiti | 0 | 0 | 0 | 0 | 0 | 0 | 0 | 0 | 0 | 0 | 0.5 | 0.6 | 1.1 | 1.4 | 1.5 | 1.9 | 1.9 | 2.4 | 2.6 | 2.6 | 2.6 |
| HND | Honduras | 1.6 | 1.8 | 2 | 2.1 | 2.4 | 2.7 | 2.9 | 3.2 | 3.2 | 3.5 | 3.7 | 4.5 | 5.2 | 5.2 | 5.2 | 393 | 414 | 454 | 514 | 516 | 516 |
| HUN | Hungary | 0 | 0 | 0 | 0 | 0 | 0 | 0 | 0.4 | 1 | 1 | 2 | 4 | 12 | 35 | 89 | 172 | 235 | 344 | 728 | 1,400 | 1,953 |
| ISL | Iceland | 0 | 0 | 0 | 0 | 0 | 0 | 0 | 0 | 0 | 0 | 0 | 0 | 0.6 | 0.9 | 1.1 | 2.5 | 3.5 | 4.3 | 5.3 | 7 | 7 |
| IND | India | 1.1 | 5.5 | 6.7 | 7.9 | 7.8 | 11.6 | 9.6 | 25.1 | 27.7 | 39.4 | 65.4 | 563 | 979 | 1,446 | 3,444 | 5,365 | 9,651 | 17,923 | 27,125 | 34,861 | 38,983 |
| IDN | Indonesia | 0.3 | 0.6 | 0.9 | 1.3 | 1.3 | 1.4 | 2.2 | 5.7 | 9.5 | 13.4 | 14.6 | 17 | 26.4 | 38.4 | 41.6 | 78.6 | 88.4 | 97.5 | 69.1 | 155 | 172 |
| IRN | Iran (Islamic Republic of) | 0 | 0 | 0 | 0 | 0 | 0 | 0.1 | 0.1 | 0.1 | 0.2 | 0.4 | 0.4 | 0.4 | 1 | 9.4 | 9.4 | 43.2 | 184 | 286 | 346 | 430 |
| IRQ | Iraq | 0 | 0 | 0 | 0 | 0 | 0 | 0 | 0 | 0 | 0 | 0 | 0 | 0 | 29.5 | 36.5 | 36.5 | 36.5 | 36.5 | 216 | 216 | 216 |
| IRL | Ireland | 0 | 0 | 0 | 0 | 0 | 0 | 0 | 0 | 0 | 0.6 | 0.7 | 0.8 | 0.9 | 1 | 1.6 | 2.4 | 5.9 | 15.7 | 24.2 | 31.1 | 40.2 |
| ISR | Israel | 0 | 0 | 0 | 0 | 0 | 1 | 1.3 | 1.8 | 3 | 24.5 | 69.9 | 190 | 237 | 420 | 670 | 766 | 866 | 969 | 1,070 | 1,190 | 2,230 |
| ITA | Italy | 19 | 20 | 22 | 26 | 31 | 34 | 45 | 110 | 483 | 1,264 | 3,592 | 13,131 | 16,785 | 18,185 | 18,594 | 18,901 | 19,283 | 19,682 | 20,108 | 20,865 | 21,594 |
| JAM | Jamaica | 0 | 0.1 | 0.1 | 0.1 | 0.2 | 0.2 | 0.2 | 0.4 | 0.6 | 0.7 | 1 | 1.5 | 1.8 | 2.1 | 4.1 | 6.5 | 27.5 | 55.5 | 55.5 | 92.5 | 92.5 |
| JPN | Japan | 330 | 453 | 637 | 860 | 1,132 | 1,422 | 1,708 | 1,919 | 2,144 | 2,627 | 3,618 | 4,914 | 6,632 | 13,599 | 23,339 | 34,150 | 42,040 | 49,500 | 56,162 | 63,192 | 68,665 |
| JOR | Jordan | 0 | 0 | 0 | 0 | 0 | 0 | 0 | 0 | 0 | 0 | 0 | 0 | 0.1 | 0.1 | 0.2 | 5.5 | 296 | 406 | 809 | 1,101 | 1,359 |
| KAZ | Kazakhstan | 0 | 0 | 0 | 0 | 0 | 0.1 | 0.1 | 0.7 | 1.1 | 1.3 | 2.6 | 3.6 | 6 | 15.8 | 76.3 | 144 | 157 | 175 | 490 | 1,150 | 1,719 |
| KEN | Kenya | 0 | 0 | 0 | 0 | 0 | 0 | 0 | 0 | 0.2 | 0.2 | 0.2 | 1.4 | 3.4 | 7.2 | 16.7 | 30.8 | 31.9 | 39.1 | 105 | 106 | 106 |
| KIR | Kiribati | 0.1 | 0.1 | 0.1 | 0.1 | 0.2 | 0.2 | 0.2 | 0.3 | 0.3 | 0.3 | 0.4 | 0.4 | 0.5 | 0.5 | 0.8 | 2.3 | 2.9 | 2.9 | 2.9 | 2.9 | 2.9 |
| PRK | Korea (the Democratic People's Republic of) | 0 | 0 | 0 | 0.3 | 0.3 | 0.4 | 0.4 | 0.5 | 0.5 | 0.6 | 1 | 1.7 | 2.3 | 6.1 | 11 | 22.8 | 31.5 | 34.8 | 37.8 | 41.8 | 41.8 |
| KOR | Korea (the Republic of) | 4 | 5 | 5 | 6 | 9 | 14 | 36 | 81 | 357 | 524 | 650 | 730 | 1,024 | 1,555 | 2,481 | 3,615 | 4,502 | 5,835 | 8,099 | 11,952 | 14,575 |
| XKO | Kosovo | 0 | 0 | 0 | 0 | 0 | 0 | 0 | 0 | 0 | 0 | 0 | 0 | 0 | 0 | 0 | 0.1 | 2 | 6.6 | 6.6 | 10 | 10 |
| KWT | Kuwait | 0 | 0 | 0 | 0 | 0 | 0 | 0 | 0 | 0 | 0 | 0 | 0 | 0 | 0.1 | 2 | 3.2 | 30.5 | 32 | 43.1 | 43.3 | 43.3 |
| LAO | Lao People's Democratic Republic (the) | 0 | 0 | 0 | 0 | 0 | 0 | 0 | 0 | 0 | 0 | 0 | 0 | 0 | 0.5 | 2.9 | 3.3 | 3.6 | 21.6 | 21.6 | 21.6 | 21.6 |
| LVA | Latvia | 0 | 0 | 0 | 0 | 0 | 0 | 0 | 0 | 0 | 0 | 0 | 0 | 0.2 | 0.2 | 0.2 | 0.2 | 0.7 | 0.7 | 2 | 3.3 | 7.2 |
| LBN | Lebanon | 0 | 0 | 0 | 0 | 0 | 0 | 0 | 0 | 0 | 0 | 0.3 | 0.5 | 0.8 | 1.9 | 4.8 | 11.4 | 24.6 | 37.4 | 56.5 | 78.7 | 78.7 |
| LSO | Lesotho | 0 | 0 | 0 | 0 | 0 | 0 | 0 | 0 | 0 | 0 | 0 | 0 | 0 | 0.4 | 0.4 | 0.4 | 0.4 | 0.4 | 0.4 | 0.4 | 0.4 |
| LBR | Liberia | 0 | 0 | 0 | 0 | 0 | 0 | 0 | 0 | 0 | 0 | 0 | 0 | 0 | 0 | 0 | 0.1 | 0.1 | 2.4 | 2.6 | 2.6 | 2.6 |
| LBY | Libya | 0 | 0 | 0 | 0.2 | 0.7 | 1.2 | 1.7 | 2.2 | 2.7 | 3.2 | 3.7 | 4.2 | 4.9 | 4.9 | 4.9 | 4.9 | 4.9 | 5.1 | 5.1 | 5.1 | 5.1 |
| LTU | Lithuania | 0 | 0 | 0 | 0 | 0 | 0 | 0 | 0 | 0.1 | 0.1 | 0.1 | 0.3 | 7 | 68 | 69 | 69 | 70 | 73.8 | 82 | 82 | 148 |
| LUX | Luxembourg | 0 | 0.2 | 1.6 | 14.2 | 23.6 | 23.6 | 23.7 | 23.9 | 24.6 | 26.4 | 29.5 | 40.7 | 74.7 | 95 | 110 | 116 | 122 | 128 | 131 | 160 | 195 |
| MDG | Madagascar | 0 | 0 | 0 | 0 | 0.1 | 0.1 | 0.3 | 0.4 | 0.8 | 1.1 | 1.5 | 2 | 2.6 | 5 | 7 | 9 | 11 | 13 | 33.4 | 34.2 | 33 |
| MWI | Malawi | 0 | 0 | 0 | 0 | 0 | 0 | 0.1 | 0.2 | 0.3 | 0.5 | 0.7 | 1.8 | 2.7 | 5.4 | 7.7 | 12.1 | 12.1 | 19.2 | 22.7 | 22.7 | 24 |
| MYS | Malaysia | 0 | 0 | 0 | 0 | 0 | 0 | 0 | 0.5 | 0.5 | 0.5 | 0.5 | 0.5 | 25.1 | 97.1 | 166 | 229 | 279 | 370 | 536 | 882 | 1,493 |
| MDV | Maldives | 0 | 0 | 0 | 0 | 0 | 0 | 0.1 | 0.1 | 0.1 | 0.2 | 0.3 | 0.3 | 1.4 | 1.8 | 4.1 | 4.1 | 6.8 | 9.5 | 9.5 | 13.2 | 15.2 |
| MLI | Mali | 0.1 | 0.3 | 0.4 | 0.8 | 1.4 | 1.7 | 2.5 | 3.4 | 3.9 | 3.9 | 6.4 | 9.9 | 15.7 | 15.7 | 16.2 | 17.2 | 17.6 | 19.3 | 19.3 | 19.3 | 69.5 |
| MLT | Malta | 0 | 0 | 0 | 0 | 0 | 0.1 | 0.1 | 0.1 | 0.2 | 0.9 | 0.8 | 5.3 | 15.7 | 28.5 | 54.6 | 74.8 | 93.6 | 112 | 131 | 154 | 184 |
| MHL | Marshall Islands (the) | 0 | 0 | 0 | 0 | 0.1 | 0.1 | 0.1 | 0.1 | 0.2 | 0.3 | 0.3 | 0.3 | 0.5 | 0.7 | 1 | 1 | 1.6 | 1.6 | 1.6 | 1.6 | 1.6 |
| MTQ | Martinique | 0 | 0 | 0 | 0 | 0 | 0 | 2.5 | 4 | 7.3 | 14.2 | 26.4 | 48 | 60 | 62 | 62.5 | 65.4 | 66.9 | 68.4 | 71 | 75.8 | 76 |
| MRT | Mauritania | 0 | 0 | 0 | 0 | 0 | 0 | 0 | 0 | 0 | 0 | 0 | 0 | 0 | 18 | 18.2 | 18.2 | 34.8 | 34.8 | 86.8 | 87.5 | 87.5 |
| MUS | Mauritius | 0 | 0 | 0 | 0 | 0 | 0 | 0 | 0 | 0 | 0 | 0 | 0 | 1.4 | 2.5 | 18.2 | 18.7 | 27.3 | 28.8 | 67.5 | 83.5 | 83.5 |
| MYT | Mayotte | 0 | 0 | 0 | 0 | 0 | 0 | 0 | 0 | 0.5 | 1.8 | 8.3 | 12.4 | 13.1 | 13.1 | 13.2 | 13.2 | 13.3 | 15.1 | 15.1 | 15.1 | 15.1 |
| MEX | Mexico | 14 | 15 | 16 | 16 | 16 | 16 | 16 | 19 | 19 | 25 | 29 | 39 | 60 | 82 | 116 | 173 | 389 | 674 | 2,541 | 4,426 | 5,630 |
| FSM | Micronesia (Federated States of) | 0.1 | 0.1 | 0.1 | 0.1 | 0.1 | 0.1 | 0.1 | 0.2 | 0.2 | 0.5 | 0.5 | 0.5 | 0.5 | 0.7 | 0.7 | 0.7 | 1.3 | 1.3 | 1.9 | 1.9 | 1.9 |
| MDA | Moldova (the Republic of) | 0 | 0 | 0 | 0 | 0 | 0 | 0 | 0 | 0 | 0 | 0 | 0 | 0 | 0 | 1 | 1 | 2.3 | 2.1 | 3 | 5 | 5 |
| MNG | Mongolia | 0 | 0 | 0 | 0.2 | 0.2 | 0.2 | 0.2 | 0.2 | 3.8 | 3.8 | 4.6 | 4.6 | 4.6 | 5 | 5 | 5 | 15 | 47.7 | 64.2 | 89.2 | 89.6 |
| MNE | Montenegro | 0 | 0 | 0 | 0 | 0 | 0 | 0 | 0.2 | 0.4 | 0.4 | 0.6 | 0.8 | 0.9 | 1.1 | 2.1 | 2.7 | 3.1 | 3.4 | 4.5 | 5.3 | 6.2 |
| MSR | Montserrat | 0 | 0 | 0 | 0 | 0 | 0 | 0 | 0 | 0 | 0 | 0 | 0 | 0 | 0 | 0 | 0 | 0 | 0 | 0 | 0.3 | 0.3 |
| MAR | Morocco | 6.7 | 7 | 7.7 | 8.4 | 9.1 | 10 | 10.8 | 11.9 | 12.8 | 13.4 | 13.5 | 14.2 | 15.2 | 15.2 | 19.6 | 19.8 | 21.9 | 23.9 | 194 | 194 | 194 |
| MOZ | Mozambique | 0 | 0 | 0 | 0 | 0 | 0 | 0 | 0 | 0 | 0 | 0 | 0.5 | 1.5 | 4.9 | 7 | 10 | 13 | 15 | 55 | 95 | 95 |
| MMR | Myanmar | 0 | 0 | 0 | 0 | 0 | 0 | 0 | 0.1 | 0.1 | 0.2 | 0.4 | 1.4 | 2.8 | 4.2 | 6.3 | 20.8 | 32 | 43.8 | 47.5 | 88.5 | 84.5 |
| NAM | Namibia | 1 | 1.2 | 1.5 | 1.6 | 1.6 | 1.6 | 1.9 | 2.4 | 3 | 3.6 | 4.2 | 7.4 | 11.1 | 14.6 | 16.5 | 21 | 36 | 74.8 | 92.5 | 145 | 145 |
| NRU | Nauru | 0 | 0 | 0 | 0 | 0 | 0 | 0 | 0 | 0 | 0 | 0 | 0 | 0.1 | 0.2 | 0.2 | 0.2 | 0.7 | 0.7 | 0.8 | 1.9 | 1.9 |
| NPL | Nepal | 0 | 0.3 | 0.6 | 1 | 1.4 | 1.9 | 1.8 | 1.6 | 2 | 3.8 | 4.3 | 8.5 | 9.3 | 10.8 | 11.5 | 13.4 | 13.6 | 54.3 | 52.5 | 50.7 | 60.5 |
| NLD | Netherlands (the) | 13 | 21 | 26 | 46 | 50 | 51 | 53 | 54 | 59 | 69 | 90 | 149 | 287 | 650 | 1,007 | 1,526 | 2,135 | 2,911 | 4,608 | 7,177 | 10,213 |
| NCL | New Caledonia | 0.2 | 0.2 | 0.2 | 0.3 | 0.3 | 0.3 | 0.3 | 0.5 | 0.5 | 0.6 | 2.7 | 3.2 | 3.2 | 3.2 | 3.4 | 6.8 | 8.8 | 26.2 | 28.6 | 61.8 | 80 |
| NZL | New Zealand | 0 | 0 | 0 | 0 | 0 | 0 | 0 | 3 | 3 | 3 | 3 | 3 | 4 | 8 | 22 | 37 | 53 | 70 | 90 | 116 | 142 |
| NIC | Nicaragua | 0 | 0 | 0 | 0 | 0 | 0 | 0 | 0 | 0 | 0 | 0 | 0 | 0 | 1.4 | 1.4 | 1.4 | 1.4 | 14 | 14 | 16.4 | 16.4 |
| NER | Niger (the) | 0.5 | 0.6 | 0.6 | 0.7 | 0.8 | 1 | 1.1 | 1.1 | 1.2 | 1.2 | 2.1 | 3 | 4 | 5 | 6 | 7 | 8 | 9 | 27 | 27 | 27 |
| NGA | Nigeria | 0 | 0 | 0 | 0 | 0 | 0 | 0 | 0 | 0 | 0 | 0 | 0 | 15.2 | 15.4 | 15.6 | 17 | 18.4 | 18.9 | 19.1 | 28 | 28.4 |
| NIU | Niue | 0 | 0 | 0 | 0 | 0 | 0 | 0 | 0 | 0 | 0.1 | 0.1 | 0.1 | 0.1 | 0.1 | 0.3 | 0.3 | 0.3 | 0.3 | 0.3 | 0.9 | 0.9 |
| MKD | North Macedonia | 0 | 0 | 0 | 0 | 0 | 0 | 0 | 0 | 0 | 0 | 0 | 2 | 4 | 7 | 15 | 17 | 16.7 | 16.7 | 20.6 | 26.2 | 94.4 |
| NOR | Norway | 6 | 6 | 6 | 7 | 7 | 7 | 8 | 8 | 8.3 | 8.7 | 9.1 | 9.5 | 10 | 11 | 13 | 15 | 26.7 | 44.9 | 68.4 | 120 | 152 |
| OMN | Oman | 0 | 0 | 0 | 0 | 0 | 0 | 0 | 0 | 0 | 0 | 0 | 0 | 0 | 0.7 | 0.7 | 2.2 | 2.2 | 8.2 | 8.3 | 8.7 | 109 |
| PAK | Pakistan | 0 | 0 | 0 | 0 | 0 | 0 | 0 | 0.1 | 1.1 | 3.7 | 9.3 | 18.6 | 45.8 | 101 | 165 | 266 | 589 | 655 | 679 | 713 | 737 |
| PLW | Palau | 0 | 0 | 0 | 0 | 0 | 0 | 0 | 0 | 0.3 | 0.3 | 0.3 | 0.6 | 0.7 | 0.7 | 0.9 | 0.9 | 1.3 | 1.3 | 1.7 | 1.7 | 1.7 |
| PSE | Palestine, State of | 0 | 0 | 0 | 0 | 0 | 0 | 0 | 0 | 0 | 0 | 0 | 0.4 | 0.6 | 0.6 | 3 | 12 | 25 | 35 | 40 | 81.8 | 117 |
| PAN | Panama | 0.2 | 0.4 | 0.5 | 0.6 | 0.6 | 0.8 | 0.8 | 1 | 1.3 | 1.5 | 1.9 | 2.4 | 3 | 3.7 | 6.1 | 49.3 | 93 | 147 | 193 | 198 | 198 |
| PNG | Papua New Guinea | 0 | 0.3 | 0.3 | 0.3 | 0.3 | 0.3 | 0.3 | 0.3 | 0.3 | 0.3 | 0.3 | 0.3 | 0.3 | 0.3 | 0.3 | 0.9 | 1.2 | 1.2 | 1.3 | 1.3 | 1.3 |
| PRY | Paraguay | 0 | 0 | 0 | 0 | 0 | 0 | 0 | 0 | 0 | 0 | 0 | 0 | 0 | 0.1 | 0.1 | 0.1 | 0.1 | 0.1 | 0.1 | 0.1 | 0.1 |
| PER | Peru | 0.9 | 1.9 | 3 | 3.5 | 4.3 | 5 | 5.8 | 6.8 | 8 | 9.8 | 12.5 | 17.5 | 103 | 109 | 134 | 139 | 146 | 298 | 325 | 331 | 331 |
| PHL | Philippines (the) | 0 | 0 | 0 | 0 | 2 | 2 | 2 | 2 | 2 | 2 | 2 | 2 | 2 | 3 | 27.7 | 173 | 784 | 908 | 914 | 973 | 1,048 |
| POL | Poland | 0 | 0 | 0 | 0 | 0 | 0 | 0 | 0 | 0 | 0 | 0 | 1.1 | 1.3 | 2.4 | 27.2 | 108 | 187 | 287 | 562 | 1,539 | 3,936 |
| PRT | Portugal | 1 | 1 | 1 | 2 | 2 | 2 | 3 | 24 | 59 | 115 | 134 | 172 | 238 | 296 | 415 | 447 | 513 | 579 | 667 | 901 | 1,025 |
| PRI | Puerto Rico | 0 | 0 | 0 | 0 | 0 | 0 | 0 | 0 | 0 | 3.8 | 3.8 | 3.8 | 6.9 | 57.9 | 72.9 | 88.4 | 133 | 165 | 165 | 165 | 158 |
| QAT | Qatar | 0 | 0 | 0 | 0 | 0 | 0 | 0 | 0 | 0 | 0 | 0 | 0.7 | 0.7 | 2.3 | 4 | 4 | 5.1 | 5.1 | 5.1 | 5.1 | 5.1 |
| REU | Réunion | 0 | 0 | 0 | 0 | 0.3 | 0.5 | 3 | 5.8 | 10 | 42.5 | 89.3 | 131 | 153 | 156 | 167 | 187 | 186 | 188 | 190 | 191 | 191 |
| ROM | Romania | 0 | 0 | 0 | 0 | 0 | 0 | 0 | 0 | 0.1 | 0.1 | 0.1 | 1 | 41 | 761 | 1,293 | 1,326 | 1,372 | 1,374 | 1,386 | 1,398 | 1,387 |
| RUS | Russian Federation (the) | 0 | 0 | 0 | 0 | 0 | 0 | 0 | 0 | 0 | 0 | 0 | 0 | 0.1 | 1.3 | 5 | 61.3 | 76.3 | 225 | 535 | 1,276 | 1,428 |
| RWA | Rwanda | 0 | 0 | 0 | 0 | 0 | 0 | 0 | 0.3 | 0.3 | 0.3 | 0.3 | 0.3 | 0.5 | 0.9 | 10 | 14 | 19.2 | 27.3 | 31 | 31 | 31 |
| WSM | Samoa | 0 | 0 | 0 | 0 | 0 | 0 | 0 | 0 | 0 | 0 | 0 | 0 | 0 | 0.2 | 3.1 | 4.8 | 7.2 | 13.5 | 13.5 | 13.5 | 13.5 |
| STP | São Tomé and Príncipe | 0 | 0 | 0 | 0 | 0 | 0 | 0 | 0 | 0 | 0 | 0 | 0 | 0 | 0.1 | 0.1 | 0.1 | 0.2 | 0.3 | 0.3 | 0.3 | 0.3 |
| SAU | Saudi Arabia | 0.4 | 0.4 | 0.4 | 0.4 | 0.4 | 0.4 | 0.4 | 0.4 | 0.4 | 0.4 | 2.4 | 2.9 | 13.6 | 22.5 | 24.3 | 24.3 | 24.3 | 34.4 | 34.4 | 359 | 359 |
| SEN | Senegal | 1 | 1.1 | 1.3 | 1.4 | 1.6 | 1.7 | 1.8 | 2 | 2.3 | 2.6 | 3.3 | 4.8 | 5.9 | 7 | 9 | 9 | 42 | 107 | 148 | 171 | 171 |
| SRB | Serbia | 0 | 0 | 0 | 0 | 0 | 0.7 | 0.9 | 0.9 | 2.3 | 3 | 3.3 | 3.7 | 7.1 | 9.7 | 13.4 | 15.8 | 17.2 | 18.4 | 20.8 | 23.4 | 28.8 |
| SYC | Seychelles | 0 | 0 | 0 | 0 | 0 | 0 | 0 | 0 | 0 | 0 | 0 | 0 | 0 | 0.3 | 1 | 1.4 | 1.9 | 2.6 | 3.7 | 3.7 | 3.8 |
| SLE | Sierra Leone | 0 | 0 | 0 | 0 | 0 | 0 | 0 | 0 | 0 | 0.1 | 0.1 | 0.2 | 0.2 | 0.4 | 0.4 | 0.4 | 0.5 | 3.8 | 4.4 | 4.4 | 4.4 |
| SGP | Singapore | 0 | 0 | 0 | 0 | 0 | 0 | 0 | 0 | 0.3 | 1.5 | 3 | 4.6 | 7.8 | 11.8 | 25.3 | 45.7 | 96.6 | 116 | 160 | 272 | 329 |
| SVK | Slovakia | 0 | 0 | 0 | 0 | 0 | 0 | 0 | 0 | 0 | 0 | 19 | 496 | 513 | 533 | 533 | 533 | 533 | 528 | 472 | 590 | 593 |
| SVN | Slovenia | 1 | 1 | 1 | 1 | 1 | 1 | 1 | 1 | 1 | 4 | 12 | 57 | 142 | 187 | 223 | 238 | 233 | 247 | 247 | 264 | 267 |
| SLB | Solomon Islands | 0 | 0 | 0 | 0 | 0 | 0 | 0 | 0 | 0 | 0 | 0 | 0.8 | 0.8 | 0.8 | 1.1 | 1.1 | 2.2 | 2.5 | 2.5 | 2.5 | 2.5 |
| SOM | Somalia | 0 | 0 | 0 | 0 | 0 | 0 | 0 | 0 | 0 | 0 | 0 | 0 | 0 | 0 | 0.1 | 0.2 | 4.7 | 6.9 | 7.1 | 7.1 | 22.5 |
| ZAF | South Africa | 0 | 0 | 0 | 0 | 0 | 0 | 0 | 0 | 0 | 0 | 2 | 5.7 | 11.3 | 262 | 1,063 | 1,252 | 1,974 | 3,147 | 4,401 | 4,405 | 5,490 |
| SSD | South Sudan | 0 | 0 | 0 | 0 | 0 | 0 | 0 | 0 | 0 | 0 | 0 | 0 | 0.2 | 0.2 | 0.2 | 0.2 | 0.4 | 0.4 | 0.6 | 0.6 | 0.6 |
| ESP | Spain | 10 | 13 | 17 | 22 | 33 | 52 | 130 | 494 | 3,384 | 3,423 | 3,873 | 4,283 | 4,569 | 4,690 | 4,697 | 4,704 | 4,713 | 4,723 | 4,764 | 8,973 | 11,785 |
| LKA | Sri Lanka | 0.3 | 0.9 | 1.6 | 2.3 | 2.9 | 3.6 | 4.2 | 4.9 | 5.6 | 6.3 | 7 | 9.6 | 9.7 | 13 | 19.6 | 31.2 | 62.5 | 131 | 185 | 215 | 230 |
| BLM | Saint Barthélemy | 0 | 0 | 0 | 0 | 0 | 0 | 0 | 0 | 0 | 0 | 0 | 0 | 0 | 0 | 0 | 0 | 0 | 0 | 0 | 0 | 0 |
| KNA | Saint Kitts and Nevis | 0 | 0 | 0 | 0 | 0 | 0 | 0 | 0 | 0 | 0 | 0 | 0 | 0 | 0.4 | 1.4 | 1.4 | 1.9 | 1.9 | 1.9 | 1.9 | 1.9 |
| LCA | Saint Lucia | 0 | 0 | 0 | 0 | 0 | 0 | 0 | 0 | 0 | 0 | 0 | 0 | 0.1 | 0.1 | 0.1 | 0.8 | 0.8 | 0.8 | 3.8 | 3.8 | 3.8 |
| MAF | Saint Martin (French part) | 0 | 0 | 0 | 0 | 0 | 0 | 0 | 0 | 0 | 0 | 0 | 0 | 0 | 1.4 | 1.6 | 2.6 | 1.8 | 0.1 | 0.1 | 0.5 | 0.5 |
| VCT | Saint Vincent and the Grenadines | 0 | 0 | 0 | 0 | 0 | 0 | 0 | 0 | 0 | 0 | 0 | 0 | 0.1 | 0.4 | 0.4 | 0.8 | 1.2 | 1.3 | 1.3 | 1.9 | 1.9 |
| SDN | Sudan (the) | 0 | 0 | 0 | 0 | 0.1 | 0.2 | 0.2 | 0.4 | 0.5 | 0.9 | 2.3 | 3.5 | 8 | 8 | 8 | 11.1 | 12.3 | 12.6 | 12.6 | 17.9 | 17.9 |
| SUR | Suriname | 0 | 0 | 0 | 0 | 0 | 0 | 0 | 0 | 0 | 0 | 0.2 | 0.3 | 0.7 | 0.9 | 6.2 | 6.2 | 6.7 | 7.7 | 8.8 | 8.8 | 9.4 |
| SWE | Sweden | 3 | 3 | 3 | 4 | 4 | 4 | 5 | 6 | 8 | 9 | 11 | 12 | 24 | 43 | 60 | 104 | 153 | 244 | 428 | 714 | 1,417 |
| CHE | Switzerland | 16 | 18 | 20 | 22 | 24 | 28 | 30 | 37 | 49 | 79 | 125 | 223 | 437 | 756 | 1,061 | 1,394 | 1,664 | 1,906 | 2,173 | 2,498 | 2,943 |
| SYR | Syrian Arab Republic (the) | 0 | 0 | 0 | 0 | 0 | 0 | 0 | 0 | 0 | 0 | 0 | 0 | 0 | 0 | 0 | 0 | 0 | 0.1 | 1.4 | 2.5 | 2.5 |
| TZA | Tanzania, the United Republic of | 0 | 0 | 0 | 0 | 0 | 0 | 0 | 0 | 0 | 0 | 0 | 0.3 | 1.2 | 3.7 | 11.2 | 12.8 | 18.5 | 22.1 | 26.5 | 26.6 | 23.6 |
| THA | Thailand | 0 | 0 | 0 | 0 | 0 | 0 | 30.4 | 32.3 | 32.4 | 37 | 48.6 | 78.7 | 377 | 824 | 1,299 | 1,420 | 2,446 | 2,697 | 2,962 | 2,983 | 2,983 |
| TMP | East Timor | 0 | 0 | 0 | 0 | 0.1 | 0.1 | 0.1 | 0.1 | 0.1 | 0.1 | 0.1 | 0.1 | 0.1 | 0.7 | 0.7 | 0.7 | 0.7 | 0.7 | 0.7 | 0.7 | 0.7 |
| TGO | Togo | 0 | 0 | 0 | 0 | 0 | 0 | 0 | 0 | 0 | 0 | 0.1 | 0.3 | 0.4 | 0.4 | 0.8 | 1.7 | 2.1 | 2.5 | 3.5 | 5.5 | 5.6 |
| TKL | Tokelau | 0 | 0 | 0 | 0 | 0 | 0 | 0 | 0 | 0 | 0 | 0 | 0 | 1 | 1 | 1 | 1 | 1 | 1 | 1 | 1 | 1 |
| TON | Tonga | 0.1 | 0.1 | 0.1 | 0.1 | 0.1 | 0.1 | 0.1 | 0.1 | 0.1 | 0.1 | 0.1 | 0.1 | 1.1 | 1.7 | 1.7 | 2.7 | 3.2 | 6.2 | 6.2 | 6.2 | 6.2 |
| TTO | Trinidad and Tobago | 0.3 | 0.7 | 0.9 | 1.2 | 1.7 | 1.8 | 2 | 2.1 | 2.3 | 2.5 | 2.8 | 2.8 | 2.8 | 2.8 | 3.1 | 3.6 | 3.6 | 3.6 | 3 | 3 | 3 |
| TUN | Tunisia | 0.8 | 1 | 1.1 | 1.1 | 1.2 | 1.2 | 1.2 | 1.2 | 1.3 | 1.4 | 1.8 | 2.9 | 5.6 | 9.5 | 17.1 | 27.5 | 41 | 50.8 | 63.7 | 80 | 94.9 |
| TUR | Turkey | 0.1 | 0.3 | 0.6 | 1 | 1.5 | 2 | 2.5 | 3 | 3.7 | 4.7 | 5.7 | 6.7 | 11.7 | 17.7 | 40 | 249 | 833 | 3,421 | 5,063 | 5,995 | 6,667 |
| TCA | Turks and Caicos Islands (the) | 0 | 0 | 0 | 0 | 0 | 0 | 0 | 0 | 0 | 0 | 0 | 0 | 0 | 0 | 0 | 0 | 0 | 0.2 | 0.4 | 0.9 | 0.9 |
| TUV | Tuvalu | 0 | 0 | 0 | 0 | 0 | 0 | 0 | 0 | 0 | 0.2 | 0.2 | 0.2 | 0.2 | 0.2 | 0.3 | 2.1 | 2.2 | 2.2 | 2.2 | 2.2 | 2.3 |
| UGA | Uganda | 0.2 | 0.8 | 1.1 | 1.7 | 2.3 | 3 | 5.4 | 7.7 | 11.7 | 14.2 | 14.9 | 16.2 | 17.3 | 18.5 | 20 | 22 | 24 | 43.6 | 66.8 | 77 | 77.3 |
| GBR | United Kingdom of Great Britain and Northern Ireland (the) | 2 | 3 | 4 | 6 | 8 | 11 | 14 | 18 | 23 | 27 | 95 | 1,000 | 1,753 | 2,937 | 5,528 | 9,601 | 11,914 | 12,760 | 13,073 | 13,346 | 13,462 |
| UKR | Ukraine | 0 | 0 | 0 | 0 | 0 | 0 | 0 | 0 | 0 | 0 | 2.5 | 188 | 372 | 748 | 819 | 841 | 955 | 1,200 | 2,003 | 5,936 | 7,331 |
| ARE | United Arab Emirates (the) | 0 | 0 | 0 | 0 | 0 | 0 | 0 | 0 | 0 | 10.1 | 10.8 | 12.8 | 13.2 | 25.8 | 33.2 | 33.4 | 40.4 | 255 | 498 | 1,818 | 2,439 |
| URY | Uruguay | 0 | 0 | 0 | 0 | 0 | 0 | 0 | 0 | 0.1 | 0.1 | 0.1 | 0.4 | 0.6 | 1.1 | 3.2 | 6 | 10.5 | 243 | 248 | 254 | 258 |
| VIR | Virgin Islands (U.S.) | 0 | 0 | 0 | 0 | 0 | 0 | 0 | 0 | 0 | 0 | 0 | 0.5 | 0.6 | 0.9 | 5 | 9.2 | 9.2 | 5 | 5 | 5 | 5 |
| USA | United States of America (the) | 176 | 213 | 255 | 293 | 363 | 493 | 698 | 974 | 1,153 | 1,614 | 2,909 | 5,172 | 8,137 | 11,759 | 15,984 | 21,684 | 32,958 | 41,357 | 49,812 | 59,068 | 73,814 |
| UZB | Uzbekistan | 0 | 0 | 0 | 0 | 0 | 0 | 0 | 0 | 0 | 0 | 0 | 0 | 0 | 1 | 1.1 | 1.1 | 2.3 | 3.2 | 3.5 | 3.5 | 3.5 |
| VUT | Vanuatu | 0 | 0 | 0 | 0 | 0 | 0 | 0 | 0 | 0 | 0 | 0 | 0.1 | 0.2 | 0.2 | 0.3 | 0.4 | 1.8 | 2.7 | 4.1 | 4.3 | 4.2 |
| VEN | Venezuela (Bolivarian Republic of) | 0 | 0 | 0 | 0 | 0 | 0 | 0 | 0 | 0 | 0 | 1.8 | 2 | 2.3 | 2.3 | 3.4 | 4.5 | 4.5 | 4.5 | 4 | 5.3 | 5.3 |
| VNM | Viet Nam | 0 | 0.1 | 0.2 | 0.4 | 0.7 | 1.9 | 3.4 | 3.4 | 3.4 | 3.5 | 4.5 | 4.5 | 4.5 | 4.5 | 5.3 | 5.3 | 5.3 | 8 | 105 | 4,898 | 16,504 |
| YEM | Yemen | 0 | 0 | 0 | 0 | 0 | 0 | 0 | 0 | 0.9 | 1 | 1 | 1.3 | 1.4 | 2.4 | 5 | 60 | 80 | 100 | 250 | 250 | 253 |
| ZMB | Zambia | 0 | 0 | 0 | 0 | 0 | 0 | 0 | 0 | 0 | 0 | 0 | 0 | 0 | 0.1 | 0.1 | 0.1 | 0.1 | 0.1 | 1.2 | 96.4 | 99.4 |
| ZWE | Zimbabwe | 0 | 0 | 0 | 0 | 0 | 0 | 0 | 0 | 0 | 0 | 0 | 0.2 | 0.9 | 2 | 2.7 | 4.3 | 5.1 | 6.3 | 10.6 | 11.1 | 17 |
| WORLD TOTAL | 987 | 1,369 | 1,798 | 2,562 | 4,358 | 6,830 | 9,329 | 13,513 | 25,150 | 39,659 | 70,482 | 125,593 | 172,860 | 217,837 | 262,783 | 318,307 | 396,289 | 496,651 | 598,134 | 715,685 | 860,175 |
See also
Notes
References
- "Chart: Solar installations set to break global, US records in 2023". Canary Media. 15 September 2023. Archived from the original on 17 September 2023. For relevant chart, Canary Media credits: "Source: BloombergNEF, September 2023"
- Chase, Jenny (5 September 2023). "3Q 2023 Global PV Market Outlook". BloombergNEF. Archived from the original on 21 September 2023.
- Jaeger, Joel (20 September 2021). "Explaining the Exponential Growth of Renewable Energy".
- Lacey, Stephen (12 September 2011). "How China dominates solar power". Guardian Environment Network. Retrieved 29 June 2014.
- Wolfe, Philip (2012). Solar Photovoltaic Projects in the mainstream power market. Routledge. p. 225. ISBN 9780415520485.
- "Crossing the Chasm" (PDF). Deutsche Bank Markets Research. 27 February 2015. Archived (PDF) from the original on 30 March 2015.
- Wolfe, Philip (2018). The Solar Generation. Wiley - IEEE. p. 81. ISBN 9781119425588.
- Snapshot of Global PV Markets 2023, IEA Photovoltaic Power Systems Programme.
- "Snapshot 2020 – IEA-PVPS". iea-pvps.org. Retrieved 10 May 2020.
- "The projections for the future and quality in the past of the World Energy Outlook for solar PV and other renewable energy technologies" (PDF). Energywatchgroup. September 2015. Archived from the original (PDF) on 15 September 2016.
- Osmundsen, Terje (4 March 2014). "How the IEA exaggerates the costs and underestimates the growth of solar power". Energy Post. Archived from the original on 13 November 2014. Retrieved 30 October 2014.
- Whitmore, Adam (14 October 2013). "Why Have IEA Renewables Growth Projections Been So Much Lower Than the Out-Turn?". The Energy Collective. Archived from the original on 30 October 2014. Retrieved 30 October 2014.
- "Transition in Energy, Transport – 10 Predictions for 2019 – 2. Solar additions rise despite China". BNEF – Bloomberg New Energy Finance. 16 January 2019. Retrieved 15 February 2019.
- International Energy Agency (2014). "Technology Roadmap: Solar Photovoltaic Energy" (PDF). iea.org. IEA. Archived (PDF) from the original on 1 October 2014. Retrieved 7 October 2014.
- "One Chart Shows How Solar Could Dominate Electricity in 30 Years". Business Insider. 30 September 2014.
- "Electric generator capacity factors vary widely around the world". eia.gov. 6 September 2015. Retrieved 17 June 2018.
- "Global Market Outlook for Photovoltaics 2014–2018" (PDF). epia.org. EPIA – European Photovoltaic Industry Association. Archived (PDF) from the original on 25 June 2014. Retrieved 12 June 2014.
- "Snapshot of Global PV 1992–2013" (PDF). iea-pvps.org/index.php?id=trends0. International Energy Agency – Photovoltaic Power Systems Programme. 31 March 2014. Archived (PDF) from the original on 7 April 2014.
- Alter, Lloyd (31 January 2017). "Tesla kills the duck with big batteries". TreeHugger. Retrieved 16 March 2017.
- LeBeau, Phil (8 March 2017). "Tesla battery packs power the Hawaiian island of Kauai after dark". CNBC. Retrieved 16 March 2017.
- "2018 Snapshot of Global Photovoltaic Markets" (PDF). International Energy Agency. 2018. Report IEA PVPS T1-33:2018.
- IEA: Global Installed PV Capacity Leaps to 303 Gigawatts, greentechmedia, Eric Wesoff, 27 April 2017
- "Snapshot of Global Photovoltaic Markets 2017" (PDF). report. International Energy Agency. 19 April 2018. Retrieved 11 July 2017.
- Renewable Capacity Statistics (PDF). IRENA. 2019. pp. 24–26. ISBN 978-92-9260-123-2. Retrieved 3 May 2019.
- "IEA PVPS Snapshot of Global PV 2019" (PDF). IEA.
- "Renewable Capacity Statistics 2020". irena.org. 31 March 2020. Retrieved 23 May 2020.
- "Snapshot 2021". IEA-PVPS. International Energy Agency.
- "Renewable Capacity Statistics 2021" (PDF). irena.org. Retrieved 9 April 2021.
- "Snapshot 2022". IEA-PVPS. International Energy Agency.
- "RENEWABLE CAPACITY STATISTICS 2022, page 32" (PDF). irena.org. Retrieved 22 April 2022.
- "RENEWABLE CAPACITY STATISTICS 2023, page 32". irena.org. 21 March 2023. Retrieved 23 March 2023.
- "Snapshot 2023" (PDF).
- "Brazil To Hit 2 Gigawatts Of Installed Solar By End Of 2018". CleanTechnia. 15 May 2018.
- "Infografico da Absolar".
- Brasil termina 2021 com maior acréscimo em potência instalada desde 2016
- "Red Eléctrica de España | Series estadísticas nacionales". ree.es (in Spanish). Retrieved 4 July 2017.
- "Hernieuwbare elektriciteit; productie en vermogen". opendata.cbs.nl (in Dutch). Retrieved 25 June 2023.
- "Share of electricity production from solar". Our World in Data. 2023. Retrieved 6 July 2023.
- "Solar share of electricity load in 2022". Energy-Charts. 5 July 2023. Retrieved 6 July 2023.
- "UA energy statistics 2020". ua.energy. UKRENERGO. 13 April 2021. Retrieved 14 April 2021.
- Evelin Szőke (4 July 2022). "Hungary had the highest rate of solar-based electricity production in the EU last year". CEENERGYNEWS. Retrieved 3 July 2023.
- "Informe Mensual: Diciembre 2022" (PDF). CAMMESA. p. 21.
- "IEA PVPS National Survey Report of PV Power Applications in Finland 2018". IEA PVPS. 23 July 2019. p. 6. Retrieved 30 July 2019. It refers to PDF National Survey Report of PV Power Applications in Finland 2018 visible from that page http://iea-pvps.org/index.php?id=93 that is viewed through Google Docs to prevent auto-downloading of PDF.
- "Publication_Singapore_Energy_Statistics, Energy Market Authority" (PDF) (Press release).
- "Distribution of electricity generation in Lithuania in 2022, by source". Statista Research Department. 30 June 2023. Retrieved 5 July 2023.
- "Cyprus: Solar photovoltaic electricity production 2012-2018". Statista.com. 2019.
- "Malta national electricity supply 2021" (Press release). National Statistics Office, Malta. 6 October 2022.
- "China's solar capacity overtakes Germany in 2015, industry data show". Reuters. 21 January 2016.
- Wolfe, Philip (2018). The Solar Generation. Wiley - IEEE. p. 120. ISBN 9781119425588.
- United States Patent and Trademark Office – Database
- Magic Plates, Tap Sun For Power. Popular Science. June 1931. Retrieved 2 August 2013.
- "Bell Labs Demonstrates the First Practical Silicon Solar Cell". aps.org.
- D. M. Chapin-C. S. Fuller-G. L. Pearson (1954). "A New Silicon p–n Junction Photocell for Converting Solar Radiation into Electrical Power". Journal of Applied Physics. 25 (5): 676–677. Bibcode:1954JAP....25..676C. doi:10.1063/1.1721711.
- Biello David (6 August 2010). "Where Did the Carter White House's Solar Panels Go?". Scientific American. Retrieved 31 July 2014.
- Pollack, Andrew (24 February 1996). "REACTOR ACCIDENT IN JAPAN IMPERILS ENERGY PROGRAM". The New York Times.
- wise-paris.org Sodium Leak and Fire at Monju
- S Hill, Joshua (22 January 2016). "China Overtakes Germany To Become World's Leading Solar PV Country". Clean Technica. Retrieved 16 August 2016.
- "NEA: China added 34.24 GW of solar PV capacity in 2016". solarserver.com. Retrieved 22 January 2017.
- "China to cut on-grid tariffs for solar, wind power: state planner". Reuters. 24 December 2015. Archived from the original on 25 April 2023.
- "The Latest in Clean Energy News".
- "China to plow $361 billion into renewable fuel by 2020". Reuters. 5 January 2017. Retrieved 22 January 2017.
- Baraniuk, Chris (22 June 2017). "Future Energy: China leads world in solar power production". BBC News. Retrieved 27 June 2017.
- "China wasted enough renewable energy to power Beijing for an entire year, says Greenpeace". 19 April 2017. Retrieved 19 April 2017.
- "China to erect fewer farms, generate less solar power in 2017". 19 April 2017. Retrieved 19 April 2017.
- "Solar (photovoltaic) panel prices vs. cumulative capacity". OurWorldInData.org. 2023. Archived from the original on 29 September 2023. OWID credits source data to: Nemet (2009); Farmer & Lafond (2016); International Renewable Energy Agency (IRENA).
- "Price quotes updated weekly – PV Spot Prices". PV EnergyTrend. Retrieved 13 July 2020.
- "PriceQuotes". pv.energytrend.com. Archived from the original on 30 June 2014. Retrieved 26 June 2014.
- "Sunny Uplands: Alternative energy will no longer be alternative". The Economist. 21 November 2012. Retrieved 28 December 2012.
- J. Doyne Farmer, François Lafond (2 November 2015). "How predictable is technological progress?". Research Policy. 45 (3): 647–665. arXiv:1502.05274. doi:10.1016/j.respol.2015.11.001. S2CID 154564641. License: cc. Note: Appendix F. A trend extrapolation of solar energy capacity.
- "Photovoltaic System Pricing Trends – Historical, Recent, and Near-Term Projections, 2014 Edition" (PDF). NREL. 22 September 2014. p. 4. Archived (PDF) from the original on 26 February 2015.
- "Solar PV Pricing Continues to Fall During a Record-Breaking 2014". GreenTechMedia. 13 March 2015.
- "Photovoltaik-Preisindex" [Solar PV price index]. PhotovoltaikGuide. Archived from the original on 10 July 2017. Retrieved 30 March 2015.
Turnkey net-prices for a solar PV system of up to 100 kWp amounted to Euro 1,240 per kWp.
- Renewable Power Generation Costs in 2018 (PDF). Abu Dhabi: International Renewable Energy Agency. 2019. pp. 20–22. Retrieved 25 November 2019.
- "Photovoltaics Report" (PDF). Fraunhofer ISE. 22 September 2022. Archived (PDF) from the original on 23 September 2022.
- RenewableEnergyWorld.com How thin film solar fares vs crystalline silicon, 3 January 2011
- Diane Cardwell; Keith Bradsher (9 January 2013). "Chinese Firm Buys U.S. Solar Start-Up". The New York Times. Retrieved 10 January 2013.
- "Photovoltaics Report" (PDF). Fraunhofer ISE. 28 July 2014. Archived (PDF) from the original on 9 August 2014. Retrieved 31 August 2014.
- "Solar Frontier Completes Construction of the Tohoku Plant". Solar Frontier. 2 April 2015. Retrieved 30 April 2015.
- Andorka, Frank (8 January 2014). "CIGS Solar Cells, Simplified". Solar Power World. Archived from the original on 19 August 2014. Retrieved 16 August 2014.
- "Nyngan Solar Plant". AGL Energy Online. Retrieved 18 June 2015.
- CleanTechnica.com First Solar Reports Largest Quarterly Decline In CdTe Module Cost Per-Watt Since 2007, 7 November 2013
- Raabe, Steve; Jaffe, Mark (4 November 2012). "Bankrupt Abound Solar of Colo. lives on as political football". The Denver Post.
- "The End Arrives for ECD Solar". greentechmedia.com. Retrieved 27 January 2016.
- "Oerlikon Divests Its Solar Business and the Fate of Amorphous Silicon PV". greentechmedia.com. Retrieved 27 January 2016.
- GreenTechMedia.com Rest in Peace: The List of Deceased Solar Companies, 6 April 2013
- "NovaSolar, Formerly OptiSolar, Leaving Smoking Crater in Fremont". greentechmedia.com. Retrieved 27 January 2016.
- "Chinese Subsidiary of Suntech Power Declares Bankruptcy". The New York Times. 20 March 2013.
- "Suntech Seeks New Cash After China Bankruptcy, Liquidator Says". Bloomberg News. 29 April 2014.
- Wired.com Silicon Shortage Stalls Solar 28 March 2005
- "Solar State of the Market Q3 2008 – Rise of Upgraded Metallurgical Silicon" (PDF). SolarWeb. Lux Research Inc. p. 1. Archived from the original (PDF) on 18 October 2014. Retrieved 12 October 2014.
- "IEA PVPS TRENDS 2014 in Photovoltaic Applications" (PDF). iea-pvps.org/index.php?id=trends. 12 October 2014. Archived (PDF) from the original on 28 December 2014.
- "Annual Report 2013/2014" (PDF). ISE.Fraunhofer.de. Fraunhofer Institute for Solar Energy Systems-ISE. 2014. p. 1. Archived (PDF) from the original on 5 November 2014. Retrieved 5 November 2014.
- Europa.eu EU initiates anti-dumping investigation on solar panel imports from China
- U.S. Imposes Anti-Dumping Duties on Chinese Solar Imports, 12 May 2012
- Europa.eu EU imposes definitive measures on Chinese solar panels, confirms undertaking with Chinese solar panel exporters, 2 December 2013
- "China to levy duties on US polysilicon imports". China Daily. 16 September 2013. Archived from the original on 5 March 2016.
- "Global Market Outlook for Solar Power 2015–2019" (PDF). solarpowereurope.org. Solar Power Europe (SPE), formerly known as EPIA – European Photovoltaic Industry Association. Archived from the original (PDF) on 10 June 2015. Retrieved 9 June 2015.
- Global Solar Market Demand Expected To Reach 100 Gigawatts In 2017, Says SolarPower Europe, CleanTechnica, 27 October 2017
- "All I want for Christmas is 400 GW of solar installed in 2023". 23 December 2022.
-
"Statistical Review of World Energy – Historical Data Workbook BP". bp.com. BP. Retrieved 1 April 2015.
downloadable XL-spread sheet
- "Renewable energy - BP Statistical Review of World Energy 2020" (PDF). BP. 22 September 2020. Archived (PDF) from the original on 21 September 2020.
- "Renewable Capacity Statistics 2021" (PDF). IRENA. 22 March 2021. Archived from the original on 5 April 2021.
- "RENEWABLE CAPACITY STATISTICS 2022, page 32" (PDF). irena.org. Retrieved 22 April 2022.
- Lewis, Michelle (15 June 2021). "US solar sets a Q1 record, but there may be trouble ahead". Electrek. Retrieved 18 June 2021.
- "TRENDS IN PHOTOVOLTAIC APPLICATIONS – Survey report of selected IEA countries between 1992 and 2008". iea-pvps.org/. International Energy Agency – Photovoltaic Power Systems Programme. 2009. Retrieved 28 December 2014.
- "TRENDS IN PHOTOVOLTAIC APPLICATIONS – Survey report of selected IEA countries between 1992 and 2009". iea-pvps.org/. International Energy Agency – Photovoltaic Power Systems Programme. 2010. Retrieved 28 December 2014.
- "TRENDS IN PHOTOVOLTAIC APPLICATIONS – Survey report of selected IEA countries between 1992 and 2010". iea-pvps.org/. International Energy Agency – Photovoltaic Power Systems Programme. 2011. Retrieved 28 December 2014.
- "Global Market Outlook for Photovoltaics until 2016" (PDF). epia.org. EPIA – European Photovoltaic Industry Association. Archived (PDF) from the original on 20 March 2013. Retrieved 6 November 2014.
- EUROBSER'VER. "Photovoltaic Barometer – installations 2010 and 2011" (PDF). energies-renouvelables.org. p. 6. Archived (PDF) from the original on 10 August 2014. Retrieved 1 May 2013.
- "Global Market Outlook for Photovoltaics 2013–2017" (PDF). epia.org. EPIA – European Photovoltaic Industry Association. Archived (PDF) from the original on 19 February 2015. Retrieved 6 November 2014.
- "IEA PVPS TRENDS 2013 in Photovoltaic Applications" (PDF). iea-pvps.org/index.php?id=92. 29 November 2013. Archived (PDF) from the original on 2 April 2015.
- "Snapshot of Global PV 1992–2014" (PDF). iea-pvps.org/index.php?id=32. International Energy Agency – Photovoltaic Power Systems Programme. 30 March 2015. Archived from the original on 7 April 2015.
- EUROBSER'VER (April 2015). "Photovoltaic Barometer – installations 2013 and 2014" (PDF). energies-renouvelables.org. Archived (PDF) from the original on 18 May 2015.
- "Snapshot of Global PV 1992–2015" (PDF). iea-pvps.org. International Energy Agency – Photovoltaic Power Systems Programme. 2015.
- EUROBSER'VER (April 2016). "Photovoltaic Barometer – installations 2014 and 2015" (PDF). energies-renouvelables.org. Archived (PDF) from the original on 13 January 2017.
- "Trends 2016 in Photovoltaic Applications – Survey report of selected IEA countries between 1992 and 2015" (PDF). iea-pvps.org. International Energy Agency – Photovoltaic Power Systems Programme. 2016. Archived from the original on 10 July 2019. Retrieved 11 January 2017.
- PV Barometre at the end of 2013, page 6
- Centro de Energías Renovables, CORFO (July 2014). "Reporte CER". Retrieved 22 July 2014.
- "Photovoltaic stations". T-Solar Group. Retrieved 16 May 2015.
Repartición solar farm, Location: Municipalidad Distrital La Joya. Province: Arequipa. Power: 22 MWp
- "Latin America's Largest Solar Power Plant Receiving 40 MW of Solar PV Modules from Yingli Solar (Peru)". CleanTechnica. 15 October 2012.
- "Statistics – Solar photovoltaics deployment". gov.uk. DECC – Department of Energy & Climate Change. 2015. Retrieved 26 February 2015.
- "Why DECC struggles to keep up with solar PV capacity data...and why we don't". Solar Power Portal. 26 June 2015.
- "Latin America Country Markets 2014-2015E". GTM Research. 10 May 2015.
- EUROBSER'VER. "Photovoltaic Barometer – installations 2012 and 2013" (PDF). energies-renouvelables.org. Archived (PDF) from the original on 15 September 2014. Retrieved 1 May 2014.
- EUROBSER'VER. "Photovoltaic Barometer – installations 2011 and 2012" (PDF). energies-renouvelables.org. p. 7. Archived (PDF) from the original on 5 November 2013. Retrieved 1 May 2013.
- EUROBSER'VER. "Photovoltaic Barometer – installations 2009 and 2010" (PDF). energies-renouvelables.org. p. 4. Archived (PDF) from the original on 20 May 2013. Retrieved 1 May 2013.
- EUROBSER'VER. "Photovoltaic Barometer – installations 2008 and 2009" (PDF). energies-renouvelables.org. p. 5. Archived (PDF) from the original on 18 December 2013. Retrieved 1 May 2013.
- Renewable capacity statistics 2021 (PDF). 2021. ISBN 978-92-9260-342-7. Retrieved 16 September 2021.
{{cite book}}:|website=ignored (help)
External links
- IEA–International Energy Agency, Publications
- IEA–PVPS, IEA's Photovoltaic Power System Programme
- NREL–National Renewable Energy Laboratory, Publications
- FHI–ISE, Fraunhofer Institute for Solar Energy Systems
- APVI–Australian PV Institute
- EPIA–European Photovoltaic Industry Association
- SEIA–Solar Energy Industries Association
- CanSIA–Canadian Solar Industries Association
- Presentation on YouTube – Cost analysis of current PV production, PV learning curve – UNSW, Pierre Verlinden, Trina Solar
- Interview on YouTube – Michael Liebreich, "Cheapest Solar in World", about the record-low 5.84 US cents/kWh PPA in Dubai (2014)