Deployment diagram
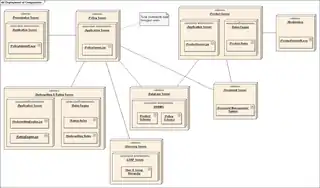
A deployment diagram in the Unified Modeling Language models the physical deployment of artifacts on nodes.[1] To describe a web site, for example, a deployment diagram would show what hardware components ("nodes") exist (e.g., a web server, an application server, and a database server), what software components ("artifacts") run on each node (e.g., web application, database), and how the different pieces are connected (e.g. JDBC, REST, RMI).

| UML diagram types |
|---|
| Structural UML diagrams |
| Behavioral UML diagrams |
The nodes appear as boxes, and the artifacts allocated to each node appear as rectangles within the boxes. Nodes may have subnodes, which appear as nested boxes. A single node in a deployment diagram may conceptually represent multiple physical nodes, such as a cluster of database servers.
There are two types of Nodes:
- Device Node
- Execution Environment Node
Device nodes are physical computing resources with processing memory and services to execute software, such as typical computers or mobile phones. An execution environment node (EEN) is a software computing resource that runs within an outer node and which itself provides a service to host and execute other executable software elements.
References
- Deployment diagrams show "the allocation of Artifacts to Nodes according to the Deployments defined between them." Unified Modeling Language, Superstructure, V2.1.2 Archived 2011-06-06 at the Wayback Machine p. 202.
External links
- Introduction to UML 2 Deployment Diagrams by Scott W. Ambler
- UML 2 Deployment Diagram
- UML Deployment Diagrams
