Bromley London Borough Council elections
Bromley London Borough Council is the local authority for the London Borough of Bromley. The council is elected every four years.
Political control
The first election to the council was held in 1964, initially operating as a shadow authority before the new system came into full effect the following year. Political control of the council since 1964 has been held by the following parties:
| Election | Overall Control | Conservative | Labour | Lib Dem | UKIP | Ind/Localist | |
|---|---|---|---|---|---|---|---|
| 1964 | Conservative | 28 | 15 | 7 | - | - | |
| 1968 | Conservative | 52 | 5 | 3 | - | - | |
| 1971 | Conservative | 41 | 15 | 4 | - | - | |
| 1974 | Conservative | 44 | 14 | 2 | - | - | |
| 1978 | Conservative | 48 | 12 | - | - | - | |
| 1982 | Conservative | 52 | 5 | 3 | - | - | |
| 1986 | Conservative | 44 | 10 | 6 | - | - | |
| 1990 | Conservative | 43 | 11 | 6 | - | - | |
| 1994 | Conservative | 32 | 7 | 21 | - | - | |
| 1998 | No overall control | 28 | 7 | 25 | - | - | |
| 2002 | Conservative | 41 | 6 | 13 | - | - | |
| 2006 | Conservative | 49 | 4 | 7 | - | - | |
| 2010 | Conservative | 53 | 3 | 4 | - | - | |
| 2014 | Conservative | 51 | 7 | - | 2 | - | |
| 2018 | Conservative | 50 | 8 | - | - | 2 | |
| 2022 | Conservative | 36 | 12 | 5 | - | 5 | |
Leadership
The leaders of the council since 1967 have been:[1][2]
| Councillor | Party | From | To | |
|---|---|---|---|---|
| Michael Neubert[3] | Conservative | 1967 | 1971 | |
| Horace Walter Haden | Conservative | 1971 | 1972 | |
| Dennis Barkway | Conservative | 1972 | 1976 | |
| Simon Randall | Conservative | 1976 | 1981 | |
| Dennis Barkway | Conservative | 1981 | 1996 | |
| Frank Cooke | Conservative | 1996 | 1997 | |
| Michael Tickner | Conservative | 1997 | 1998 | |
| Chris Maines (Liberal Democrat) and Sue Polydorou (Labour) (joint leaders) | No overall control | 1998 | 1999 | |
| Chris Maines (Liberal Democrat) and John Holbrook (Labour) (joint leaders) | No overall control | 1999 | 2001 | |
| Michael Tickner | Conservative | 2001 | 2003 | |
| Russell Mellor | Conservative | 2003 | 2004 | |
| Stephen Carr[4] | Conservative | 2004 | 15 Sep 2017 | |
| Colin Smith | Conservative | 25 Sep 2017 | ||
Council elections
- 1964 Bromley London Borough Council election
- 1968 Bromley London Borough Council election
- 1971 Bromley London Borough Council election (boundary changes took place but the number of seats remained the same)[5][n 1]
- 1974 Bromley London Borough Council election
- 1978 Bromley London Borough Council election (boundary changes took place but the number of seats remained the same)[6]
- 1982 Bromley London Borough Council election
- 1986 Bromley London Borough Council election
- 1990 Bromley London Borough Council election
- 1994 Bromley London Borough Council election (boundary changes took place but the number of seats remained the same)[n 2][n 3][n 4][n 5][n 6]
- 1998 Bromley London Borough Council election
- 2002 Bromley London Borough Council election (boundary changes took place but the number of seats remained the same)[7]
- 2006 Bromley London Borough Council election
- 2010 Bromley London Borough Council election
- 2014 Bromley London Borough Council election
- 2018 Bromley London Borough Council election
- 2022 Bromley London Borough Council election
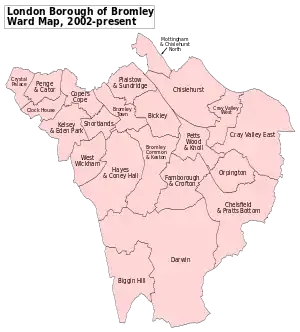
Borough result maps
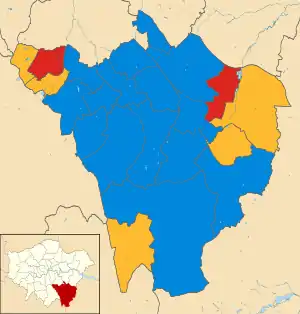 2002 results map
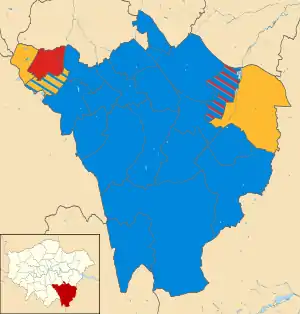 2006 results map
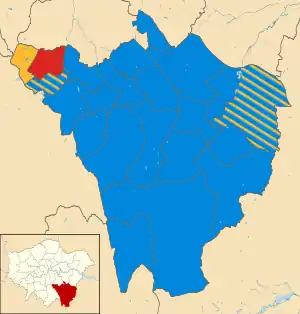 2010 results map
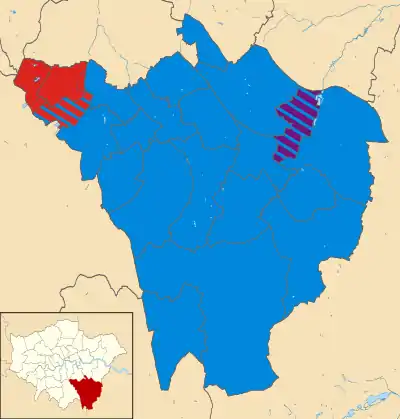 2014 results map
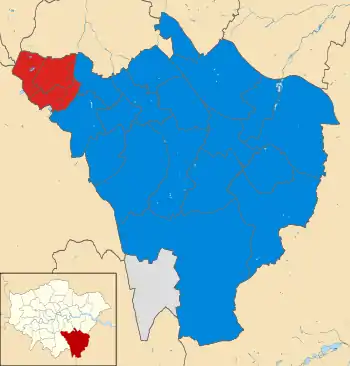 2018 results map
By-election results
1964-1968
| Party | Candidate | Votes | % | ±% | |
|---|---|---|---|---|---|
| Conservative | Christopher David Mchenry Knox-Johnston | 809 | 49.7 | ||
| Liberal | Joyce M Cater | 775 | 47.6 | ||
| Labour | Gustav C White | 43 | 2.6 | ||
| Turnout | |||||
1968-1971
| Party | Candidate | Votes | % | ±% | |
|---|---|---|---|---|---|
| Conservative | J. Smith | 1,977 | |||
| Liberal | W. R. Edwards | 250 | |||
| Labour | Mrs E. Leys | 183 | |||
| Turnout | 22.7 | ||||
| Party | Candidate | Votes | % | ±% | |
|---|---|---|---|---|---|
| Conservative | K. J. Harding | 3,165 | |||
| Liberal | Keith H. Lock | 2,010 | |||
| Labour | J. R. Constable | 188 | |||
| Turnout | 41.3 | ||||
| Party | Candidate | Votes | % | ±% | |
|---|---|---|---|---|---|
| Conservative | Bernard E. G. Davis | 1,130 | |||
| Liberal | J. Bratt | 150 | |||
| Labour | Christopher Richard Gaster | 130 | |||
| Turnout | 17.9 | ||||
| Party | Candidate | Votes | % | ±% | |
|---|---|---|---|---|---|
| Conservative | Mrs Jean Tatham | 1,634 | |||
| Liberal | S. D. Ellingworth | 1,579 | |||
| Labour | G. Fielding | 109 | |||
| Turnout | 49.9 | ||||
| Party | Candidate | Votes | % | ±% | |
|---|---|---|---|---|---|
| Liberal | Roy Edey | 1,292 | |||
| Conservative | Miss S. M. N. Gready | 869 | |||
| Labour | S. T. Lack | 371 | |||
| Turnout | 49.9 | ||||
| Party | Candidate | Votes | % | ±% | |
|---|---|---|---|---|---|
| Conservative | J. E. Swatton | 1,185 | |||
| Liberal | Ian Phillips | 382 | |||
| Labour | Christopher Richard Gaster | 186 | |||
| Turnout | 29.0 | ||||
| Party | Candidate | Votes | % | ±% | |
|---|---|---|---|---|---|
| Labour | Edgar C. H. Smith | 1,367 | |||
| Conservative | Albert E. Stayte | 665 | |||
| Liberal | Miss J. Fudonger | 283 | |||
| Turnout | 20.4 | ||||
| Party | Candidate | Votes | % | ±% | |
|---|---|---|---|---|---|
| Labour | D. W. Edwards | 1,511 | |||
| Conservative | Albert E. Stayte | 507 | |||
| Liberal | J. J. Hart | 166 | |||
| Turnout | 17.5 | ||||
| Party | Candidate | Votes | % | ±% | |
|---|---|---|---|---|---|
| Labour | John Spellar | 1,180 | |||
| Liberal | Michael Edwardes-Evans | 988 | |||
| Conservative | G. S. Edwards | 618 | |||
| Turnout | 28.2 | ||||
1971-1974
| Party | Candidate | Votes | % | ±% | |
|---|---|---|---|---|---|
| Labour | Arthur J. Mansfield | 1,156 | |||
| Conservative | R. C. Carter | 504 | |||
| Liberal | William Huckin | 488 | |||
| Turnout | 27.6 | ||||
| Party | Candidate | Votes | % | ±% | |
|---|---|---|---|---|---|
| Labour | Mrs M. L. Wilson | 1,809 | |||
| Conservative | Albert E. Stayte | 417 | |||
| Liberal | Mrs A. M. Parfitt | 249 | |||
| Turnout | 19.0 | ||||
| Party | Candidate | Votes | % | ±% | |
|---|---|---|---|---|---|
| Conservative | L. Sellers | 1,597 | |||
| Labour | Mrs J. Wood | 535 | |||
| Liberal | Paul David A. Nash | 188 | |||
| Turnout | 20.7 | ||||
| Party | Candidate | Votes | % | ±% | |
|---|---|---|---|---|---|
| Conservative | D. E. Johnson | 1,400 | |||
| Liberal | Mrs F. B. Kirby | 1,369 | |||
| Labour | Miss M. J. E. Healy | 220 | |||
| Turnout | 38.6 | ||||
| Party | Candidate | Votes | % | ±% | |
|---|---|---|---|---|---|
| Labour | Peter John Tozer | 2,473 | |||
| Conservative | J. A. Collins | 1,013 | |||
| Liberal | Mrs Kathleen E.C. Tarbolton | 820 | |||
| Turnout | 38.5 | ||||
| Party | Candidate | Votes | % | ±% | |
|---|---|---|---|---|---|
| Conservative | D. S. Reid | 1,020 | |||
| Labour | Gordon Thomas Yates | 799 | |||
| Liberal | Mrs M. M. Coulson | 682 | |||
| Turnout | 24.2 | ||||
| Party | Candidate | Votes | % | ±% | |
|---|---|---|---|---|---|
| Conservative | P. C. Read | 1,052 | |||
| Liberal | Peter A. Dodsworth | 956 | |||
| Labour | Robert Armstrong | 140 | |||
| Turnout | 28.6 | ||||
| Party | Candidate | Votes | % | ±% | |
|---|---|---|---|---|---|
| Conservative | B. G. Cope | 1,218 | |||
| Liberal | Jeremy V. Cope | 635 | |||
| Labour | John Richard Holbrook | 317 | |||
| Turnout | 27.4 | ||||
1974-1978
| Party | Candidate | Votes | % | ±% | |
|---|---|---|---|---|---|
| Conservative | Jennifer Mary Hillier | 2,067 | |||
| Liberal | Keith O. M. Challis | 949 | |||
| Labour | Philip R. Edwards | 368 | |||
| Turnout | 27.9 | ||||
| Party | Candidate | Votes | % | ±% | |
|---|---|---|---|---|---|
| Conservative | Alan S. Cornish | 2,272 | |||
| Liberal | Edward Babbs | 1,555 | |||
| Labour | Antoni M. Ziolkowski | 392 | |||
| Turnout | 36.3 | ||||
| Party | Candidate | Votes | % | ±% | |
|---|---|---|---|---|---|
| Conservative | Philip Geoffrey Jones | 1,898 | |||
| Liberal | Brian Harry Taylor | 1,713 | |||
| Labour | Peter W. Rance | 377 | |||
| Turnout | 35.3 | ||||
| Party | Candidate | Votes | % | ±% | |
|---|---|---|---|---|---|
| Conservative | John A. M. Lewis | 894 | |||
| Labour | Janet I. Ambrose | 741 | |||
| Liberal | Adrian G. Chapman | 298 | |||
| Turnout | 31.9 | ||||
| Party | Candidate | Votes | % | ±% | |
|---|---|---|---|---|---|
| Conservative | John A. Stewart | 1,830 | |||
| Liberal | Ian Phillips | 291 | |||
| Labour | Dr Jan Pollert | 81 | |||
| Turnout | 26.3 | ||||
| Party | Candidate | Votes | % | ±% | |
|---|---|---|---|---|---|
| Conservative | Michael J. Hughes | 1,307 | |||
| Liberal | George H. Dunk | 596 | |||
| Labour | Roy E. Hodsdon | 529 | |||
| Turnout | 35.0 | ||||
| Party | Candidate | Votes | % | ±% | |
|---|---|---|---|---|---|
| Conservative | Marion Audrey R. Roe | 828 | |||
| Liberal | Derek J. Goldsmith | 551 | |||
| Labour | Keith Aubrey Galley | 93 | |||
| Turnout | 52.0 | ||||
| Party | Candidate | Votes | % | ±% | |
|---|---|---|---|---|---|
| Labour | Derek A. Wood | 1,886 | |||
| Conservative | Albert E. Stayte | 773 | |||
| Liberal | Nicholas J. Rowden | 373 | |||
| Turnout | 24.4 | ||||
| Party | Candidate | Votes | % | ±% | |
|---|---|---|---|---|---|
| Conservative | Peter G. Nash | 2,823 | |||
| Liberal | Keith O. M. Challis | 1,804 | |||
| Labour | Philip R. Edwards | 392 | |||
| Turnout | 40.5 | ||||
| Party | Candidate | Votes | % | ±% | |
|---|---|---|---|---|---|
| Conservative | Leslie G. Whitman | 1,664 | |||
| Liberal | Alan G. Sewell | 538 | |||
| Labour | Richard J. Cox | 303 | |||
| Turnout | 31.8 | ||||
| Party | Candidate | Votes | % | ±% | |
|---|---|---|---|---|---|
| Conservative | Brian R. Reading | 2,462 | |||
| Liberal | Phillip F. Khan-Panni | 292 | |||
| Labour | Pauline M. Jones | 212 | |||
| Turnout | 34.7 | ||||
1978-1982
| Party | Candidate | Votes | % | ±% | |
|---|---|---|---|---|---|
| Conservative | Margaret Doreen Moir | 1,695 | 62.6 | -14.3 | |
| Liberal | Peter G Hardie-Bick | 423 | 15.6 | +5.0 | |
| Labour | George W Bulline | 305 | 11.3 | -1.2 | |
| Ecology | Peter J Greenwood | 286 | 10.6 | n/a | |
| Majority | 1,272 | 47.0 | -17.4 | ||
| Turnout | 2,709 | 24.9 | -20.6 | ||
| Conservative hold | Swing | -8.7 | |||
| Party | Candidate | Votes | % | ±% | |
|---|---|---|---|---|---|
| Conservative | Richard J Inniss | 1,376 | 53.9 | -13.3 | |
| Liberal | Dr Sandra E Ward | 872 | 34.2 | +11.3 | |
| Labour | Hilary U Powell | 196 | 7.7 | -2.2 | |
| Ecology | Peter J Greenwood | 107 | 4.2 | n/a | |
| Majority | 504 | 19.7 | 24.6 | ||
| Turnout | 2,551 | 31.5 | -12.8 | ||
| Conservative hold | Swing | -12.3 | |||
| Party | Candidate | Votes | % | ±% | |
|---|---|---|---|---|---|
| Ind. Conservative | Peter Charles Woods | 2,155 | 41.5 | n/a | |
| Conservative | Stewart K Hopcraft | 1,425 | 27.5 | -41.1 | |
| Liberal | Byrom Lees | 1,163 | 22.4 | +1.2 | |
| Labour | Rosalie Huzzard | 349 | 6.7 | -3.5 | |
| Ecology | John W Taylor | 98 | 1.9 | n/a | |
| Majority | 730 | 14.0 | 61.4 | ||
| Turnout | 5,190 | ||||
| Ind. Conservative gain from Conservative | Swing | +30.7 | |||
| Party | Candidate | Votes | % | ±% | |
|---|---|---|---|---|---|
| Independent | Maureen Huntley | 2,442 | 55.5 | +14.0 | |
| Conservative | Stewart K Hopcraft | 1,199 | 27.2 | -0.3 | |
| Liberal | Byrom Lees | 553 | 12.6 | -9.8 | |
| Labour | Rosalie Huzzard | 207 | 4.7 | -2.0 | |
| Majority | 1,243 | 28.3 | +14.3 | ||
| Turnout | 4,401 | 36.2 | |||
| Independent gain from Conservative | Swing | +7.1 | |||
1982-1986
| Party | Candidate | Votes | % | ±% | |
|---|---|---|---|---|---|
| Liberal | Robert H Smith | 1,738 | 50.5 | +25.4 | |
| Conservative | Robert G Straker | 1,324 | 38.5 | -14.7 | |
| Labour | Mark Cole | 377 | 11.0 | -10.7 | |
| Majority | 414 | 12.0 | 40.1 | ||
| Turnout | 3,439 | 26.4 | -25.7 | ||
| Liberal gain from Conservative | Swing | +20.0 | |||
| Party | Candidate | Votes | % | ±% | |
|---|---|---|---|---|---|
| Conservative | Christopher John Elgar | 1,410 | 63.5 | +5.7 | |
| SDP | Phyllis S Vickers | 509 | 22.9 | +1.6 | |
| Labour | Eric H Turner | 255 | 11.5 | +3.3 | |
| BNP | Andrew T Shotton | 47 | 2.1 | n/a | |
| Majority | 901 | 40.6 | +4.1 | ||
| Turnout | 2,221 | 35.0 | -10.1 | ||
| Conservative hold | Swing | +2.0 | |||
| Party | Candidate | Votes | % | ±% | |
|---|---|---|---|---|---|
| Liberal | Ervin G Muller | 1,773 | 49.0 | +23.2 | |
| Conservative | John M H Sibley | 1,602 | 44.3 | -22.6 | |
| Labour | Doris Partridge | 243 | 6.7 | -0.6 | |
| Majority | 171 | 4.7 | 45.9 | ||
| Turnout | 3,618 | 33.6 | -17.3 | ||
| Liberal gain from Conservative | Swing | +22.9 | |||
| Party | Candidate | Votes | % | ±% | |
|---|---|---|---|---|---|
| Conservative | Joan Kathleen Wykes | 2,225 | 53.2 | -18.9 | |
| SDP | Muriel A Letman | 1,418 | 33.9 | +15.8 | |
| Labour | Sheila G Donn | 491 | 11.7 | +1.8 | |
| BNP | Alfred Waite | 47 | 1.1 | n/a | |
| Majority | 807 | 19.3 | -34.7 | ||
| Turnout | 4,181 | 32.8 | -17.0 | ||
| Conservative hold | Swing | -17.3 | |||
1986-1990
| Party | Candidate | Votes | % | ±% | |
|---|---|---|---|---|---|
| Conservative | Bruce G Panes | 3,570 | 52.8 | +7.2 | |
| Liberal | Margaret Howell | 2,736 | 40.4 | -4.3 | |
| Labour | Trevor E Phillips | 458 | 6.8 | -2.9 | |
| Majority | 834 | 12.4 | +11.6 | ||
| Turnout | 55.5 | +3.6 | |||
| Conservative hold | Swing | +5.8 | |||
| Party | Candidate | Votes | % | ±% | |
|---|---|---|---|---|---|
| Liberal Democrats | Paul Jeremy Hudson Booth | 2,100 | 50.3 | +7.7 | |
| Conservative | Catherine Ann Bustard | 1,688 | 40.5 | -1.5 | |
| Labour | Peter G Warner | 384 | 9.2 | -6.2 | |
| Majority | 412 | 9.8 | +9.2 | ||
| Turnout | 32.4 | -13.5 | |||
| Liberal Democrats hold | Swing | +4.6 | |||
| Party | Candidate | Votes | % | ±% | |
|---|---|---|---|---|---|
| Labour | Patricia Mansfield | 1,258 | 54.1 | +10.7 | |
| Conservative | Celia A Manson | 549 | 23.6 | -2.5 | |
| Liberal Democrats | Richard Holbech Boultbee | 519 | 22.3 | -8.2 | |
| Majority | 709 | 30.5 | +17.6 | ||
| Turnout | 2,326 | 31.6 | -11.5 | ||
| Labour hold | Swing | +8.8 | |||
| Party | Candidate | Votes | % | ±% | |
|---|---|---|---|---|---|
| Labour | Corinna Margaret Mary Smart | 1,848 | 51.2 | +0.8 | |
| Liberal Democrats | Thomas William Hawthorne | 805 | 22.3 | +1.4 | |
| Conservative | Bernard J Cobley | 780 | 21.6 | -7.0 | |
| SDP | Terence C Simpson | 174 | 4.8 | -16.1 | |
| Majority | 1,043 | 28.9 | +7.1 | ||
| Turnout | 3,607 | 29.6 | -11.0 | ||
| Labour hold | Swing | +3.5 | |||
| Party | Candidate | Votes | % | ±% | |
|---|---|---|---|---|---|
| Conservative | Anthony M Owen | 2,368 | 52.6 | -5.4 | |
| Liberal Democrats | Harry Anthony Silvester | 1,325 | 29.4 | -3.4 | |
| Labour | Susan Ann Polydorou | 450 | 10.0 | +0.8 | |
| SDP | Christopher W Taylor | 361 | 8.0 | -24.8 | |
| Majority | 1,043 | 23.2 | -2.0 | ||
| Turnout | 4,504 | 37.5 | -13.9 | ||
| Conservative hold | Swing | -1.0 | |||
1990-1994
| Party | Candidate | Votes | % | ±% | |
|---|---|---|---|---|---|
| Conservative | Caroline Mary Hubbard | 1,810 | 56.7 | -8.3 | |
| Liberal Democrats | Jennifer Margaret Fitch | 1,156 | 36.2 | +15.4 | |
| Labour | Susan O'Dwyer | 154 | 4.8 | -9.4 | |
| SDP | Richard J. Cox | 48 | 1.5 | n/a | |
| Liberal | Carmel Martin | 23 | 0.7 | n/a | |
| Majority | 654 | 20.5 | -23.7 | ||
| Turnout | 45.3 | -3.9 | |||
| Conservative hold | Swing | -11.8 | |||
The by-election was called following the resignation of Cllr. Montague I. Blazey.
| Party | Candidate | Votes | % | ±% | |
|---|---|---|---|---|---|
| Liberal Democrats | Graem Peters | 3,931 | 69.2 | +29.9 | |
| Conservative | Anthony Neil Youd | 1,291 | 22.7 | -26.9 | |
| Labour | Charles Walter Hailes | 370 | 6.5 | -4.6 | |
| Green | Nicola C. Ellingham | 88 | 1.5 | n/a | |
| Majority | 2,640 | 46.5 | 56.8 | ||
| Turnout | 48.3 | -6.4 | |||
| Liberal Democrats gain from Conservative | Swing | +28.4 | |||
The by-election was called following the resignation of Cllr. Reginald G. Adams.
1994-1998
| Party | Candidate | Votes | % | ±% | |
|---|---|---|---|---|---|
| Conservative | Roderick A. Reed | 1,544 | |||
| Liberal Democrats | Edward Hilary Whitaker | 910 | |||
| Labour | Deborah Russell | 330 | |||
| Independent | Colin C. Cole | 55 | |||
| Liberal | George L. Whitehorn | 15 | |||
| Turnout | |||||
| Conservative hold | Swing | ||||
The by-election was called following the resignation of Cllr. Stephen R. Oxenbridge.
| Party | Candidate | Votes | % | ±% | |
|---|---|---|---|---|---|
| Conservative | Gordon William Jenkins | 2,263 | |||
| Liberal Democrats | David Malcolm Dear | 1,929 | |||
| Labour | Kelly Jane Galvin | 549 | |||
| Liberal | Ian Richmond | 80 | |||
| Turnout | |||||
| Conservative hold | Swing | ||||
The by-election was called following the resignation of Cllr. David M. Dear.
1998-2002
| Party | Candidate | Votes | % | ±% | |
|---|---|---|---|---|---|
| Conservative | John G. Gallop | 1,828 | 57.4 | -2.0 | |
| Liberal Democrats | Derek Gambell | 1,110 | 34.9 | +10.6 | |
| Labour | Alfred E. Parish | 181 | 5.7 | -10.6 | |
| National Front | Kevin Lowne | 40 | 1.3 | +1.3 | |
| Liberal | Elizabeth A. Steele | 25 | 0.8 | +0.8 | |
| Majority | 718 | 22.5 | |||
| Turnout | 3,184 | 30.2 | |||
| Conservative hold | Swing | ||||
The by-election was called following the death of Cllr. Sheila A. Humphreys.
| Party | Candidate | Votes | % | ±% | |
|---|---|---|---|---|---|
| Conservative | Stephen L. Carr | 1,754 | 46.6 | ||
| Liberal Democrats | Lennard Douglas Woods | 1,683 | 44.7 | ||
| Labour | George F. Johnstone | 195 | 5.2 | ||
| Independent | Gary Badgett | 81 | 2.2 | ||
| Green | Adrian G. Appley | 49 | 1.3 | ||
| Majority | 71 | 1.9 | |||
| Turnout | 3,762 | 31.1 | |||
| Conservative gain from Liberal Democrats | Swing | ||||
The by-election was called following the resignation of Cllr. Paul J. H. Booth.
| Party | Candidate | Votes | % | ±% | |
|---|---|---|---|---|---|
| Conservative | Timothy C. Stevens | 1,460 | 51.9 | -8.6 | |
| Liberal Democrats | Robert J. Evans | 1,195 | 42.4 | +22.5 | |
| Labour | Christopher John Price | 81 | 2.9 | -7.5 | |
| UKIP | Robert M. Bryant | 43 | 1.5 | -7.8 | |
| Green | Ann C. Garrett | 37 | 1.3 | +1.3 | |
| Majority | 265 | 9.5 | |||
| Turnout | 2,816 | 39.5 | |||
| Conservative hold | Swing | ||||
The by-election was called following the death of Cllr. Eric N. Goodman.
| Party | Candidate | Votes | % | ±% | |
|---|---|---|---|---|---|
| Conservative | Julian Patrick Greville Grainger | 2,480 | 52.9 | +10.8 | |
| Liberal Democrats | Michael Oldman | 2,122 | 45.2 | -3.3 | |
| Labour | Peter J. Lisle | 88 | 1.9 | -7.5 | |
| Majority | 358 | 7.7 | |||
| Turnout | 4,690 | 40.1 | |||
| Conservative gain from Liberal Democrats | Swing | ||||
The by-election was called following the resignation of Cllr. Graem Peters.
| Party | Candidate | Votes | % | ±% | |
|---|---|---|---|---|---|
| Conservative | Charles J. Rideout | 746 | 49.2 | +11.9 | |
| Labour | Elizabeth Ruth Johnstone | 689 | 45.5 | -4.8 | |
| Liberal Democrats | Derek Gambell | 80 | 5.3 | -7.1 | |
| Majority | 57 | 3.7 | |||
| Turnout | 1,515 | 24.6 | |||
| Conservative gain from Labour | Swing | ||||
The by-election was called following the resignation of Cllr. Robert J. Yeldham.
2002-2006
There were no by-elections.[12]
2006-2010
| Party | Candidate | Votes | % | ±% | |
|---|---|---|---|---|---|
| Liberal Democrats | Tom Papworth | 1,051 | 49.7 | +2.5 | |
| Labour | Kevin C. Brooks | 537 | 25.4 | +1.5 | |
| Conservative | Jason M. Hadden | 398 | 18.8 | +3.5 | |
| Green | Karen A. Moran | 129 | 6.1 | -7.5 | |
| Majority | 514 | 24.3 | |||
| Turnout | 2,115 | 24.7 | |||
| Liberal Democrats hold | Swing | ||||
The by-election was called following the death of Cllr. Christopher R. Gaster.
2010-2014
| Party | Candidate | Votes | % | ±% | |
|---|---|---|---|---|---|
| Conservative | David Jefferys | 1,480 | 59.4 | +2.9 | |
| Liberal Democrats | Anuja Prashar | 490 | 19.6 | -8.1 | |
| Labour | Gareth Wyn Davies | 256 | 10.2 | -2.6 | |
| UKIP | Emmett Jenner | 153 | 6.1 | N/A | |
| Green | Anna Martin | 75 | 3.0 | N/A | |
| BNP | Michael Lionel Payne | 35 | 1.4 | -5.8 | |
| Majority | 990 | ||||
| Turnout | 2,489 | ||||
| Conservative hold | Swing | ||||
The by-election was called following the resignation of Cllr. George R. Taylor.
| Party | Candidate | Votes | % | ±% | |
|---|---|---|---|---|---|
| Conservative | Ms. Nicky Dykes | 2484 | |||
| Liberal Democrats | Sam Webber | 1137 | |||
| Labour | Ms. Angela Stack | 1051 | |||
| Green | Ms. Ann C. Garrett | 404 | |||
| UKIP | Owen Brolly | 397 | |||
| Turnout | 42.8% | ||||
| Conservative hold | Swing | ||||
The by-election was called following the resignation of Cllr. Ms. Diana L. Macmull.
2018-2022
| Party | Candidate | Votes | % | ±% | |
|---|---|---|---|---|---|
| Conservative | Christine Harris | 1626 | 45.2 | +0.8 | |
| Labour | Marie Bardsley | 1046 | 29.1 | +1.7 | |
| Liberal Democrats | Julie Ireland | 633 | 17.6 | +2.7 | |
| UKIP | Graham Reakes | 219 | 6.1 | +2.4 | |
| Green | Paul Enock | 73 | 2.0 | -7.6 | |
| Turnout | 3597 | 29.17 | |||
| Conservative hold | Swing | ||||
The by-election was called following the resignation of Cllr. Dave Wibberley
| Party | Candidate | Votes | % | ±% | |
|---|---|---|---|---|---|
| Labour | Ryan David Thomson | 2235 | 53.1 | ||
| Green | Maria Costas Psaras | 820 | 19.5 | ||
| Conservative | Tom Capon | 783 | 18.6 | ||
| Liberal Democrats | Suraj Rajesh Gandecha | 370 | 8.8 | ||
| Turnout | 4208 | 42 | |||
| Labour hold | Swing | ||||
The by-election was called following the resignation of Cllr. Marina Ahmad
References
- The Greater London, Kent and Surrey Order, 1968
- The Bromley and Greenwich (London Borough Boundaries) Order 1993
- The Bromley and Lewisham (London Borough Boundaries) Order 1993
- The Bromley, Croydon, Lambeth, Lewisham and Southwark (London Borough Boundaries) Order 1993
- The Greater London and Surrey (County and London Borough Boundaries) Order 1993
- The Greater London, Kent and Surrey (County Boundaries) Order 1993
- "Council minutes". Bromley Council. Retrieved 9 July 2022.
- "London Boroughs Political Almanac". London Councils. Retrieved 5 July 2022.
- "Neubert is new leader". Shepherds Bush Gazette and Hammersmith Post. 26 January 1967. p. 1. Retrieved 9 July 2022.
- "Bromley council leader Stephen Carr announces his resignation". News Shopper. 14 September 2017. Retrieved 9 July 2022.
- "London Borough Council Elections 13 May 1971" (PDF). London Datastore. Greater London Council. Retrieved 3 March 2015.
- "London Borough Council Elections 4 May 1978" (PDF). London Datastore. Greater London Council. Retrieved 25 February 2015.
- "London Borough Council Elections 2 May 2002" (PDF). London Datastore. Greater London Authority. Retrieved 25 February 2015.
- Sevenoaks Chronicle and Kentish Advertiser
- "London Borough Council Elections 2 May 1974" (PDF). London Datastore. Greater London Council. Retrieved 25 February 2015.
- "London Borough Council By-elections May 1990 to May 1994" (PDF). London Datastore. London Research Centre. Retrieved 8 March 2015.
- "London Borough Council Elections 7 May 1998 including the Greater London Authority Referendum results" (PDF). London Datastore. London Research Centre. Retrieved 8 March 2015.
- "London Borough Council Elections 4 May 2006" (PDF). London Datastore. Greater London Authority. Retrieved 7 March 2015.
- "London Borough Council Elections 6 May 2010" (PDF). London Datastore. Greater London Authority. Retrieved 7 March 2015.
- "Statement of persons nominated - By-election in the Shortlands ward - Downloads - London Borough of Bromley". Archived from the original on 4 April 2012. Retrieved 20 October 2011.
- local_council_by-election_in_bromley_town_ward
- "London Borough Council Elections 22 May 2014" (PDF). London Datastore. Greater London Authority. Retrieved 26 February 2015.
- "Kelsey and Eden Park ward by-election 2018". Bromley Council. Bromley Council. Archived from the original on 12 November 2018. Retrieved 10 November 2018.
- "Kelsey and Eden Park by-election results". Bromley Council. Bromley Council. Retrieved 30 November 2018.
- "Crystal Palace by-election, 2021". Bromley Council. Bromley Council. Retrieved 7 May 2021.