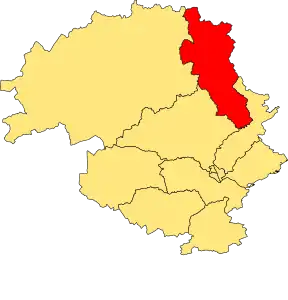
Blairgowrie and Glens (ward)
Blairgowrie and Glens is one of the twelve wards used to elect members of the Perth and Kinross Council. It elects three Councillors.
Location of the ward [1]
Councillors
| Election | Councillors | |||||||
|---|---|---|---|---|---|---|---|---|
| 2007 | Bob Ellis (SNP) |
Liz Grant (SNP) |
Caroline Shiers (Conservative) | |||||
| 2012 | ||||||||
| 2017 | Tom McEwan (SNP) |
Bob Brawn (Conservative) | ||||||
| 2022 | ||||||||
Election Results
2022 Election
2022 Perth and Kinross Council election[2]
| Party | Candidate | FPv% | Count | |||||||||
|---|---|---|---|---|---|---|---|---|---|---|---|---|
| 1 | 2 | 3 | 4 | 5 | 6 | 7 | 8 | 9 | ||||
| Conservative | Caroline Shiers (incumbent) | 25.78% | 1,202 | |||||||||
| SNP | Tom McEwen (incumbent) | 23.62% | 1,101 | 1,102.05 | 1,105.05 | 1,111.08 | 1,119.14 | 1,194.2 | ||||
| Conservative | Bob Brawn (incumbent) | 19.69% | 918 | 949.24 | 961.36 | 974.45 | 1,008.84 | 1,023.9 | 1,024.54 | 1,089.69 | 1,244.5 | |
| SNP | Harry Macfadyen | 16.65% | 776 | 776.33 | 778.33 | 780.33 | 785.36 | 811.39 | 835.72 | 889.02 | ||
| Labour | Pauline Hunter | 4.98% | 232 | 232.42 | 234.42 | 241.42 | 300.66 | 341.69 | 342.57 | |||
| Scottish Green | Louise Ramsay | 3.62% | 169 | 169.33 | 175.33 | 187.39 | 214.48 | |||||
| Liberal Democrats | Gordon Clark | 3.5% | 163 | 164.02 | 168.02 | 178.02 | ||||||
| Independent | Bernard Noonan | 1.37% | 64 | 64.27 | 65.27 | |||||||
| Scottish Family | Jack Murphy | 0.79% | 37 | 37.18 | ||||||||
| Electorate: 9,188 Valid: 4,662 Quota: 1,166 Turnout: 52.2% | ||||||||||||
2017 Election
2017 Perth and Kinross Council election[3]
| Party | Candidate | FPv% | Count | |||||
|---|---|---|---|---|---|---|---|---|
| 1 | 2 | 3 | 4 | 5 | ||||
| Conservative | Caroline Shiers (incumbent) | 36.4 | 1,641 | |||||
| SNP | Tom McEwan | 23.4 | 1,055 | 1,067.8 | 1,074.1 | 1,099.2 | 1,154.3 | |
| Conservative | Bob Brawn | 19.9 | 897 | 1,341.5 | ||||
| SNP | Alison Mulholland | 13.5 | 609 | 616.8 | 621.7 | 658.5 | 682.3 | |
| Scottish Green | Louise Ramsay | 3.6 | 164 | 171.8 | 188.2 | |||
| Liberal Democrats | Gordon Clark | 3.1 | 141 | 156.7 | 224.3 | 297.5 | ||
| Electorate: 8,607 Valid: 4,507 Spoilt: 138 Quota: 1,127 Turnout: 4,645 (53.6%) | ||||||||
2012 Election
2012 Perth and Kinross Council election[4]
| Party | Candidate | FPv% | Count | ||
|---|---|---|---|---|---|
| 1 | 2 | ||||
| SNP | Bob Ellis (incumbent) | 34.11% | 1,340 | ||
| Conservative | Caroline Shiers (incumbent) | 33.49% | 1,316 | ||
| SNP | Liz Grant (incumbent) | 21.48% | 844 | 1,152 | |
| Labour | Grant Wallace | 8.20% | 322 | 333 | |
| Liberal Democrats | Sanjay Samani | 2.72% | 107 | 114 | |
| Electorate: - Valid: 3,929 Spoilt: 66 Quota: 983 Turnout: 3,995 (%) | |||||
2007 Election
2007 Perth and Kinross Council election[5]
| Party | Candidate | FPv% | Count | ||
|---|---|---|---|---|---|
| 1 | 2 | ||||
| SNP | Bob Ellis | 33.8 | 1,680 | ||
| Conservative | Caroline Shiers | 28.9 | 1,435 | ||
| SNP | Liz Grant | 20.9 | 1,038 | 1,379 | |
| Liberal Democrats | Alison Taylor | 9.2 | 459 | 487 | |
| Labour | Roy Cameron | 7.2 | 357 | 371 | |
| Electorate: 8,319 Valid: 4,969 Spoilt: 112 Quota: 1,243 Turnout: 61.08% | |||||
References
- "5th Reviews - ward maps | Scottish Boundary Commission". lgbc-scotland.gov.uk. Archived from the original on 20 March 2020. Retrieved 22 March 2020.
- "Perth and Kinross Council 2022". 8 May 2022.
- "Perth & Kinross Council - Local Government Elections results in 2017". pkc.gov.uk. Retrieved 22 March 2020.
- "Perth & Kinross Council - Local Government Elections results in 2012". pkc.gov.uk. Retrieved 22 March 2020.
- "Perth & Kinross Council - Election results". pkc.gov.uk. Retrieved 22 March 2020.
This article is issued from Wikipedia. The text is licensed under Creative Commons - Attribution - Sharealike. Additional terms may apply for the media files.
