Almond and Earn (ward)
Almond and Earn is one of the twelve wards used to elect members of the Perth and Kinross Council. It elects three Councillors.
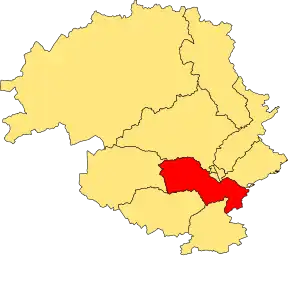
Location of the ward [1]
Councillors
| Election | Councillors | |||||||
|---|---|---|---|---|---|---|---|---|
| 2007 | Wilma Lumsden (SNP) |
George Hayton (Liberal Democrats) |
Alan Jack (Conservative Ind.) | |||||
| 2012 | Henry Anderson (SNP) |
Alan Livingstone (Conservative) |
||||||
| 2017 | Henry Anderson (SNP) |
Kathleen Baird (Conservative) |
David Illingworth (Conservative) | |||||
| 2022 | Michelle Frampton (SNP) |
Frank Smith (Conservative) | ||||||
Election Results
2022 Election
2022 Perth and Kinross Council election[2]
| Party | Candidate | FPv% | Count | |||||
|---|---|---|---|---|---|---|---|---|
| 1 | 2 | 3 | 4 | 5 | ||||
| SNP | Michelle Frampton | 33.81% | 1,339 | |||||
| Conservative | David Illingworth (incumbent) | 27.93% | 1,106 | |||||
| Conservative | Frank Smith (incumbent) | 20.35% | 806 | 817.44 | 916.73 | 933.271 | 1,035.53 | |
| Liberal Democrats | Tina Ng-A-Mann | 8.76% | 347 | 397.94 | 404.7 | 424.22 | ||
| Scottish Green | Paul Vallot | 7.88% | 312 | 503.28 | 505.15 | 521.61 | 683.39 | |
| UKIP | Lynda Davis | 1.26% | 50 | 63.77 | 64.71 | |||
| Electorate: 7,985 Valid: 3,960 Quota: 991 Turnout: 50.2% | ||||||||
2017 Election
2017 Perth and Kinross Council election[3]
| Party | Candidate | FPv% | Count | |||||
|---|---|---|---|---|---|---|---|---|
| 1 | 2 | 3 | 4 | 5 | ||||
| Conservative | Kathleen Baird (incumbent) | 42.08 | 1,724 | |||||
| SNP | Henry Anderson (incumbent) | 21.53 | 882 | 899.84 | 905.35 | 972.91 | 1,312.13 | |
| Conservative | David Illingworth | 17.5 | 717 | 1,324.36 | ||||
| SNP | Peter Glennie | 8.05 | 330 | 332.43 | 335.48 | 379.6 | ||
| Liberal Democrats | Chris Rennie | 5.61 | 230 | 253.52 | 344.1 | 435.66 | 445.7 | |
| Scottish Green | Linda Buchan | 5.22 | 214 | 232.25 | 254.07 | |||
| Electorate: TBC Valid: 4,097 Spoilt: 113 Quota: 1,025 Turnout: 4,210 (55.2%) | ||||||||
2012 Election
2012 Perth and Kinross Council election[4]
| Party | Candidate | FPv% | Count | ||||||
|---|---|---|---|---|---|---|---|---|---|
| 1 | 2 | 3 | 4 | 5 | 6 | ||||
| Conservative | Alan Livingstone | 30.14% | 1,112 | ||||||
| SNP | Henry Anderson | 24.18% | 892 | 901 | 923 | ||||
| SNP | Wilma Lumsden (incumbent) | 17.02% | 628 | 640 | 670 | 671 | 756 | ||
| Independent | Alan Jack (incumbent)†† | 12.04% | 444 | 493 | 597 | 597 | 771 | 987 | |
| Labour | Andrew Dundas | 10.0% | 369 | 381 | 451 | 451 | |||
| Liberal Democrats | George Hayton (incumbent) | 6.61% | 244 | 284 | |||||
| Electorate: - Valid: 3,689 Spoilt: 36 Quota: 923 Turnout: 3,725 (%) | |||||||||
2007 Election
2007 Perth and Kinross Council election[5]
| Party | Candidate | FPv% | Count | ||||
|---|---|---|---|---|---|---|---|
| 1 | 2 | 3 | 4 | ||||
| SNP | Wilma Lumsden | 36.6 | 1,790 | ||||
| Conservative | Alan Jack | 30.2 | 1,477 | ||||
| Liberal Democrats | George Hayton | 17.3 | 849 | 1,078 | 1,120 | 1,610 | |
| Conservative | Pamella Roberts | 15.9 | 778 | 853 | 1,017 | ||
| Electorate: 7,995 Valid: 4,894 Spoilt: 79 Quota: 1,224 Turnout: 62.20% | |||||||
References
- "5th Reviews - ward maps | Scottish Boundary Commission". lgbc-scotland.gov.uk. Retrieved 22 March 2020.
- "Perth and Kinross Council 2022". 8 May 2022.
- "Perth & Kinross Council - Local Government Elections results in 2017". pkc.gov.uk. Retrieved 22 March 2020.
- "Perth & Kinross Council - Local Government Elections results in 2012". pkc.gov.uk. Retrieved 22 March 2020.
- "Perth & Kinross Council - Election results". pkc.gov.uk. Retrieved 22 March 2020.
This article is issued from Wikipedia. The text is licensed under Creative Commons - Attribution - Sharealike. Additional terms may apply for the media files.