Bishop Auckland (UK Parliament constituency)
Bishop Auckland is a constituency in County Durham represented in the House of Commons of the UK Parliament since 2019 by Dehenna Davison, a Conservative.
| Bishop Auckland | |
|---|---|
| County constituency for the House of Commons | |
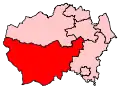 Boundary of Bishop Auckland in County Durham | |
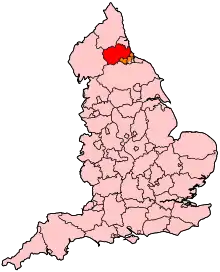 Location of County Durham within England | |
| County | County Durham |
| Population | 87,143 (2011 census)[1] |
| Electorate | 68,501 (December 2010)[2] |
| Major settlements | Bishop Auckland, Shildon, Barnard Castle, Spennymoor |
| Current constituency | |
| Created | 1885 |
| Member of Parliament | Dehenna Davison (Conservative) |
| Seats | One |
| Created from | South Durham |
Constituency profile
The constituency is located in an upland, southern part of County Durham in the North East of England. On a more local level, it comprises the whole of the former Teesdale district, and parts of the former Wear Valley district and the former Sedgefield borough.
The constituency includes as its major settlements the towns of Barnard Castle, Middleton-in-Teesdale, Bishop Auckland, Shildon, Spennymoor and its contiguous suburb village, Tudhoe, with their surrounding villages, dales and fields. The seat contains the market town of Bishop Auckland which has a mixed modern and historic high street, the similarly sized Barnard Castle, and large areas used for agriculture, particularly hill farming on the rolling landscape that cuts into the Pennines with substantial livestock.[3] Most housing, many small towns and most facilities were built in the prosperous era of coal mining which brought thousands of workers to live in Bishop Auckland town and neighbouring settlements. Manufacturing, including food processing and packaging, public sector employment, retail and agriculture are the main employers.[3]
Within the seat are Auckland Castle and Park, Lartington Hall, Windlestone Hall, Raby Castle, Binchester Roman Fort (Vinovia), The Bowes Museum, and enclosures and industrial workings on Cockfield Fell.[4]
Boundaries
1885–1918
- Part of the Sessional Division of Bishop Auckland.[5]
The constituency was created for the 1885 general election by the Redistribution of Seats Act 1885 as one of eight new single-member divisions of the county of Durham, replacing the two 2-member seats of North Durham and South Durham. See map on Vision of Britain website.[6]
1918–1950
- The Urban Districts of Bishop Auckland and Shildon; and
- part of the Rural District of Auckland.[7][8]
Gained parts of Barnard Castle, offset by losses to the new constituencies of Sedgefield and Spennymoor.
1950–1955
- The Urban Districts of Barnard Castle, Bishop Auckland, and Shildon; and
- the Rural District of Barnard Castle.[9]
The urban and rural districts of Barnard Castle transferred from the abolished constituency thereof.
1955–1974
As above, except the part of the Middridge ward transferred to the Rural District of Darlington by the County of Durham (Parish of Great Aycliffe) Confirmation Order 1952 (Statutory Instrument 1953/741).[9]
1974–1983
- The Urban Districts of Barnard Castle, Bishop Auckland, and Shildon; and
- the Rural Districts of Barnard Castle and Darlington.[10]
Gained the rural district of Darlington (which contained the new town of Newton Aycliffe) from the abolished constituency of Sedgefield.
1983–1997
- The District of Wear Valley wards of Bishop Auckland Town, Cockton Hill, Coundon, Coundon Grange, Escomb, Henknowle, St Helen's, West Auckland, and Woodhouse Close;
- the District of Teesdale; and
- the District of Sedgefield wards of Byerley, Middridge, Neville, Shafto, Simpasture, Sunnydale, Thickley, West, and Woodham.[11]
Rural areas around Darlington returned to the re-established Sedgefield constituency.
1997-present
- The District of Wear Valley wards of Bishop Auckland Town, Cockton Hill, Coundon, Coundon Grange, Escomb, Henknowle, St Helen's, West Auckland, and Woodhouse Close;
- the District of Teesdale; and
- the District of Sedgefield wards of Byerley, Low Spennymoor and Tudhoe Grange, Middlestone, Spennymoor, Sunnydale, Thickley, and Tudhoe.[12][13]
Gained Spennymoor from Sedgefield in exchange for Newton Aycliffe.
2007 Boundary review
Following a review of parliamentary representation in County Durham in 2007, the Boundary Commission for England made no changes to the Bishop Auckland constituency. In the 2009 structural changes to local government in England, the local authority districts in Durham were abolished and replaced with a single unitary authority; however, this has not affected the boundaries of the constituency.
Members of Parliament
Elections
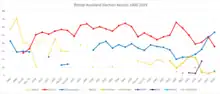
History of modern results

From 1935 to 2017 inclusive, the seat's voters returned MPs from the Labour Party; the former Labour Chancellor of the Exchequer Hugh Dalton, was the MP for Bishop Auckland from 1929 to 1931, and after regaining the seat in 1935, remained an MP until 1959. The 2019 result returned a Conservative; the party's results had shown an increase from election to election from 2001 onwards, going from 20% of the vote in the previous 1997 election to a majority of votes at 53% in 2019.
Elections in the 2010s
| Party | Candidate | Votes | % | ±% | |
|---|---|---|---|---|---|
| Conservative | Dehenna Davison | 24,067 | 53.7 | +6.8 | |
| Labour | Helen Goodman | 16,105 | 35.9 | –12.2 | |
| Brexit Party | Nicholas Brown | 2,500 | 5.6 | New | |
| Liberal Democrats | Ray Georgeson | 2,133 | 4.8 | +2.1 | |
| Majority | 7,962 | 17.8 | New | ||
| Turnout | 44,805 | 65.7 | +1.7 | ||
| Conservative gain from Labour | Swing | +9.5 | |||
| Party | Candidate | Votes | % | ±% | |
|---|---|---|---|---|---|
| Labour | Helen Goodman | 20,808 | 48.1 | +6.7 | |
| Conservative | Christopher Adams[19] | 20,306 | 46.9 | +14.4 | |
| Liberal Democrats | Ciaran Morrissey | 1,176 | 2.7 | –1.7 | |
| BNP | Adam Walker | 991 | 2.3 | New | |
| Majority | 502 | 1.2 | –7.7 | ||
| Turnout | 43,281 | 64.1 | +4.5 | ||
| Labour hold | Swing | –3.85 | |||
| Party | Candidate | Votes | % | ±% | |
|---|---|---|---|---|---|
| Labour | Helen Goodman | 16,307 | 41.4 | +2.4 | |
| Conservative | Christopher Adams | 12,799 | 32.5 | +6.2 | |
| UKIP | Rhys Burriss | 7,015 | 17.8 | +15.1 | |
| Liberal Democrats | Stephen White | 1,723 | 4.4 | –18.0 | |
| Green | Thom Robinson | 1,545 | 3.9 | New | |
| Majority | 3,508 | 8.9 | -3.8 | ||
| Turnout | 39,389 | 59.6 | -0.6 | ||
| Labour hold | Swing | –1.9 | |||
| Party | Candidate | Votes | % | ±% | |
|---|---|---|---|---|---|
| Labour | Helen Goodman | 16,023 | 39.0 | −11.1 | |
| Conservative | Barbara Harrison | 10,805 | 26.3 | +3.4 | |
| Liberal Democrats | Mark Wilkes | 9,189 | 22.3 | −1.3 | |
| BNP | Adam Walker | 2,036 | 4.9 | New | |
| Local Liberals People Before Politics | Sam Zair | 1,964 | 4.8 | New | |
| UKIP | Dave Brothers | 1,119 | 2.7 | −0.7 | |
| Majority | 5,218 | 12.7 | -13.7 | ||
| Turnout | 41,136 | 60.2 | +4.0 | ||
| Labour hold | Swing | ||||
Elections in the 2000s
| Party | Candidate | Votes | % | ±% | |
|---|---|---|---|---|---|
| Labour | Helen Goodman | 19,065 | 50.0 | −8.8 | |
| Liberal Democrats | Chris Foote Wood | 9,018 | 23.7 | +8.0 | |
| Conservative | Richard Bell | 8,736 | 22.9 | +0.2 | |
| UKIP | Margaret Hopson | 1,309 | 3.4 | New | |
| Majority | 10,047 | 26.3 | -9.8 | ||
| Turnout | 38,128 | 56.5 | −0.7 | ||
| Labour hold | Swing | ||||
| Party | Candidate | Votes | % | ±% | |
|---|---|---|---|---|---|
| Labour | Derek Foster | 22,680 | 58.8 | −7.1 | |
| Conservative | Fiona P. McNish | 8,754 | 22.7 | +2.5 | |
| Liberal Democrats | Chris Foote Wood | 6,073 | 15.7 | +6.4 | |
| Green | Carl D. Bennett | 1,052 | 2.7 | New | |
| Majority | 13,926 | 36.1 | -9.6 | ||
| Turnout | 38,559 | 57.2 | −11.2 | ||
| Labour hold | Swing | −4.8 | |||
Elections in the 1990s
| Party | Candidate | Votes | % | ±% | |
|---|---|---|---|---|---|
| Labour | Derek Foster | 30,359 | 65.9 | +15.9 | |
| Conservative | Josephine H. Fergus | 9,295 | 20.2 | −11.6 | |
| Liberal Democrats | Les Ashworth | 4,293 | 9.3 | −8.9 | |
| Referendum | David S.W. Blacker | 2,104 | 4.6 | New | |
| Majority | 21,064 | 45.7 | +27.5 | ||
| Turnout | 46,051 | 68.4 | −8.1 | ||
| Labour hold | Swing | +13.8 | |||
| Party | Candidate | Votes | % | ±% | |
|---|---|---|---|---|---|
| Labour | Derek Foster | 27,763 | 50.0 | +2.0 | |
| Conservative | David R. Williamson | 17,676 | 31.8 | −3.0 | |
| Liberal Democrats | William P. Wade | 10,099 | 18.2 | +1.0 | |
| Majority | 10,087 | 18.2 | +5.0 | ||
| Turnout | 55,538 | 76.5 | +2.4 | ||
| Labour hold | Swing | +2.5 | |||
Elections in the 1980s
| Party | Candidate | Votes | % | ±% | |
|---|---|---|---|---|---|
| Labour | Derek Foster | 25,648 | 48.0 | +3.6 | |
| Conservative | Robin Wight | 18,613 | 34.8 | −1.2 | |
| Liberal | George Irwin | 9,195 | 17.2 | −2.4 | |
| Majority | 7,035 | 13.2 | +4.8 | ||
| Turnout | 53,456 | 74.1 | +2.0 | ||
| Labour hold | Swing | +2.4 | |||
| Party | Candidate | Votes | % | ±% | |
|---|---|---|---|---|---|
| Labour | Derek Foster | 22,750 | 44.4 | -4.4 | |
| Conservative | Barry Legg | 18,444 | 36.0 | -2.0 | |
| Liberal | Arthur Collinge | 10,070 | 19.6 | +6.3 | |
| Majority | 4,306 | 8.4 | -2.4 | ||
| Turnout | 51,264 | 72.1 | −2.6 | ||
| Labour hold | Swing | ||||
Elections in the 1970s
| Party | Candidate | Votes | % | ±% | |
|---|---|---|---|---|---|
| Labour | Derek Foster | 27,200 | 48.8 | −4.0 | |
| Conservative | Michael Irvine | 21,160 | 38.0 | +6.7 | |
| Liberal | J.D. Frise | 7,439 | 13.3 | −2.6 | |
| Majority | 6,040 | 10.8 | -11.7 | ||
| Turnout | 55,799 | 74.7 | +3.8 | ||
| Labour hold | Swing | −5.4 | |||
| Party | Candidate | Votes | % | ±% | |
|---|---|---|---|---|---|
| Labour | James Boyden | 27,181 | 52.8 | +4.7 | |
| Conservative | D.W. Etheridge | 16,086 | 31.3 | −2.8 | |
| Liberal | David Lytton-Cobbold | 8,168 | 15.9 | −1.9 | |
| Majority | 11,095 | 21.5 | +7.5 | ||
| Turnout | 51,435 | 70.9 | −7.5 | ||
| Labour hold | Swing | +3.8 | |||
| Party | Candidate | Votes | % | ±% | |
|---|---|---|---|---|---|
| Labour | James Boyden | 27,101 | 48.1 | −12.6 | |
| Conservative | D.W. Etheridge | 19,226 | 34.1 | −5.2 | |
| Liberal | J.D. Frise | 10,044 | 17.8 | New | |
| Majority | 7,875 | 14.0 | -7.4 | ||
| Turnout | 56,371 | 78.4 | +7.4 | ||
| Labour hold | Swing | −3.7 | |||
| Party | Candidate | Votes | % | ±% | |
|---|---|---|---|---|---|
| Labour | James Boyden | 21,257 | 60.7 | −4.1 | |
| Conservative | Tom J. Wiseman | 13,769 | 39.3 | +4.1 | |
| Majority | 7,488 | 21.4 | -8.2 | ||
| Turnout | 35,026 | 71.0 | −2.4 | ||
| Labour hold | Swing | −4.1 | |||
Elections in the 1960s
| Party | Candidate | Votes | % | ±% | |
|---|---|---|---|---|---|
| Labour | James Boyden | 22,015 | 64.8 | +3.0 | |
| Conservative | Jeremy Vivian Ropner | 11,936 | 35.2 | −3.0 | |
| Majority | 10,079 | 29.6 | +6.0 | ||
| Turnout | 33,951 | 73.4 | −3.2 | ||
| Labour hold | Swing | +3.0 | |||
| Party | Candidate | Votes | % | ±% | |
|---|---|---|---|---|---|
| Labour | James Boyden | 22,310 | 61.8 | +6.8 | |
| Conservative | Jeremy Vivian Ropner | 13,782 | 38.2 | +4.3 | |
| Majority | 8,528 | 23.6 | +2.5 | ||
| Turnout | 36,092 | 76.2 | −4.6 | ||
| Labour hold | Swing | +1.3 | |||
Elections in the 1950s
| Party | Candidate | Votes | % | ±% | |
|---|---|---|---|---|---|
| Labour | James Boyden | 21,706 | 55.0 | −2.7 | |
| Conservative | Neil W. Murray | 13,377 | 33.9 | −8.4 | |
| Liberal | Gurney Pease | 4,377 | 11.1 | New | |
| Majority | 8,329 | 21.1 | +5.7 | ||
| Turnout | 39,460 | 80.8 | +3.8 | ||
| Labour hold | Swing | +2.9 | |||
| Party | Candidate | Votes | % | ±% | |
|---|---|---|---|---|---|
| Labour | Hugh Dalton | 21,804 | 57.7 | −2.8 | |
| Conservative | Robert Douglas M Youngson | 15,959 | 42.3 | +2.8 | |
| Majority | 5,845 | 15.4 | -5.6 | ||
| Turnout | 37,763 | 77.0 | −8.1 | ||
| Labour hold | Swing | −2.8 | |||
| Party | Candidate | Votes | % | ±% | |
|---|---|---|---|---|---|
| Labour | Hugh Dalton | 25,881 | 60.5 | +2.6 | |
| Conservative | Bruce Lionel Butcher | 16,895 | 39.5 | +7.9 | |
| Majority | 8,986 | 21.0 | -5.3 | ||
| Turnout | 42,776 | 85.1 | −1.4 | ||
| Labour hold | Swing | −5.3 | |||
| Party | Candidate | Votes | % | ±% | |
|---|---|---|---|---|---|
| Labour | Hugh Dalton | 25,039 | 57.9 | −6.2 | |
| Conservative | Antony Lambton | 13,669 | 31.6 | New | |
| Liberal | Louis William Malby | 4,527 | 10.5 | New | |
| Majority | 11,370 | 26.3 | -1.9 | ||
| Turnout | 43,235 | 86.5 | +12.5 | ||
| Labour hold | Swing | N/A | |||
Elections in the 1940s
| Party | Candidate | Votes | % | ±% | |
|---|---|---|---|---|---|
| Labour | Hugh Dalton | 20,100 | 64.1 | +1.8 | |
| National Liberal | William John Wilson Tily | 11,240 | 35.9 | New | |
| Majority | 8,860 | 28.2 | +3.6 | ||
| Turnout | 31,340 | 74.0 | −5.2 | ||
| Labour hold | Swing | N/A | |||
Elections in the 1930s
| Party | Candidate | Votes | % | ±% | |
|---|---|---|---|---|---|
| Labour | Hugh Dalton | 20,481 | 62.3 | +13.7 | |
| Liberal | Aaron Curry | 12,395 | 37.7 | -13.7 | |
| Majority | 8,086 | 24.6 | +21.8 | ||
| Turnout | 32,876 | 79.2 | -3.2 | ||
| Labour gain from Liberal | Swing | ||||
| Party | Candidate | Votes | % | ±% | |
|---|---|---|---|---|---|
| National Liberal | Aaron Curry | 17,751 | 51.4 | New | |
| Labour | Hugh Dalton | 16,796 | 48.6 | -7.2 | |
| Majority | 955 | 2.8 | N/A | ||
| Turnout | 34,547 | 82.5 | +6.0 | ||
| National Liberal gain from Labour | Swing | ||||
Elections in the 1920s
| Party | Candidate | Votes | % | ±% | |
|---|---|---|---|---|---|
| Labour | Hugh Dalton | 17,838 | 55.8 | +0.7 | |
| Liberal | Aaron Curry | 9,635 | 30.1 | −14.8 | |
| Unionist | Herbert Thompson | 4,503 | 14.1 | N/A | |
| Majority | 8,203 | 25.7 | +15.5 | ||
| Turnout | 31,976 | 76.5 | −4.4 | ||
| Registered electors | 41,772 | ||||
| Labour hold | Swing | +7.8 | |||
| Party | Candidate | Votes | % | ±% | |
|---|---|---|---|---|---|
| Labour | Ruth Dalton | 14,797 | 57.1 | +2.0 | |
| Liberal | Aaron Curry | 7,725 | 29.9 | −15.0 | |
| Unionist | Herbert Thompson | 3,357 | 13.0 | New | |
| Majority | 7,072 | 27.2 | +17.0 | ||
| Turnout | 25,879 | 74.4 | −6.5 | ||
| Registered electors | 34,787 | ||||
| Labour hold | Swing | +8.5 | |||
| Party | Candidate | Votes | % | ±% | |
|---|---|---|---|---|---|
| Labour | Ben Spoor | 15,786 | 55.1 | +3.9 | |
| Liberal | John Bainbridge | 12,868 | 44.9 | +19.2 | |
| Majority | 2,918 | 10.2 | −15.3 | ||
| Turnout | 28,654 | 80.9 | +5.4 | ||
| Registered electors | 35,438 | ||||
| Labour hold | Swing | −7.7 | |||
| Party | Candidate | Votes | % | ±% | |
|---|---|---|---|---|---|
| Labour | Ben Spoor | 13,328 | 51.2 | −2.5 | |
| Liberal | John Bainbridge | 6,686 | 25.7 | −20.6 | |
| Unionist | Robert Gee | 6,024 | 23.1 | New | |
| Majority | 6,642 | 25.5 | +18.1 | ||
| Turnout | 26,038 | 75.5 | +0.7 | ||
| Registered electors | 34,487 | ||||
| Labour hold | Swing | +9.1 | |||
| Party | Candidate | Votes | % | ±% | |
|---|---|---|---|---|---|
| Labour | Ben Spoor | 13,946 | 53.7 | +3.1 | |
| National Liberal | Egbert Atherley-Jones | 12,019 | 46.3 | New | |
| Majority | 1,927 | 7.4 | −5.9 | ||
| Turnout | 25,965 | 74.8 | +14.0 | ||
| Registered electors | 34,730 | ||||
| Labour hold | Swing | N/A | |||
Elections in the 1910s
| Party | Candidate | Votes | % | ±% | |
|---|---|---|---|---|---|
| Labour | Ben Spoor | 10,060 | 50.6 | +17.4 | |
| C | National Liberal | Godfrey Vick | 7,417 | 37.3 | New |
| Liberal | Vickerman Rutherford | 2,411 | 12.1 | −25.5 | |
| Majority | 2,643 | 13.3 | N/A | ||
| Turnout | 19,888 | 60.8 | −22.0 | ||
| Registered electors | 32,685 | ||||
| Labour gain from Liberal | Swing | ||||
| C indicates candidate endorsed by the coalition government. | |||||
Election results 1885–1918
Elections in the 1880s
| Party | Candidate | Votes | % | ±% | |
|---|---|---|---|---|---|
| Liberal | James Mellor Paulton | 5,907 | 72.2 | ||
| Conservative | Marmaduke D'Arcy Wyvill | 2,280 | 27.8 | ||
| Majority | 3,627 | 44.4 | |||
| Turnout | 8,187 | 83.0 | |||
| Registered electors | 9,858 | ||||
| Liberal win (new seat) | |||||
| Party | Candidate | Votes | % | ±% | |
|---|---|---|---|---|---|
| Liberal | James Mellor Paulton | Unopposed | |||
| Liberal hold | |||||
Elections in the 1890s
| Party | Candidate | Votes | % | ±% | |
|---|---|---|---|---|---|
| Liberal | James Mellor Paulton | 5,784 | 68.9 | N/A | |
| Conservative | Eli Waddington | 2,607 | 31.1 | New | |
| Majority | 3,177 | 37.8 | N/A | ||
| Turnout | 8,391 | 74.6 | N/A | ||
| Registered electors | 11,243 | ||||
| Liberal hold | Swing | N/A | |||
| Party | Candidate | Votes | % | ±% | |
|---|---|---|---|---|---|
| Liberal | James Mellor Paulton | 5,032 | 57.4 | -11.5 | |
| Conservative | Gervase Edward Markham | 3,735 | 42.6 | +11.5 | |
| Majority | 1,297 | 14.8 | -23.0 | ||
| Turnout | 8,767 | 79.9 | +5.3 | ||
| Registered electors | 10,979 | ||||
| Liberal hold | Swing | -11.5 | |||
Elections in the 1900s
| Party | Candidate | Votes | % | ±% | |
|---|---|---|---|---|---|
| Liberal | James Mellor Paulton | 4,872 | 57.2 | −0.2 | |
| Conservative | William Hustler Hopkins | 3,641 | 42.8 | +0.2 | |
| Majority | 1,231 | 14.4 | −0.4 | ||
| Turnout | 8,513 | 75.1 | −4.8 | ||
| Registered electors | 11,341 | ||||
| Liberal hold | Swing | −0.2 | |||
| Party | Candidate | Votes | % | ±% | |
|---|---|---|---|---|---|
| Liberal | James Mellor Paulton | 7,430 | 70.9 | +13.7 | |
| Conservative | Gervase Edward Markham | 3,056 | 29.1 | −13.7 | |
| Majority | 4,374 | 41.8 | +27.4 | ||
| Turnout | 10,486 | 82.0 | +6.9 | ||
| Registered electors | 12,790 | ||||
| Liberal hold | Swing | +13.7 | |||
Elections in the 1910s
| Party | Candidate | Votes | % | ±% | |
|---|---|---|---|---|---|
| Liberal | Henry Havelock-Allan | 5,391 | 42.1 | −28.8 | |
| Conservative | Sir Walter Clervaux Chaytor, 5th Baronet | 3,841 | 30.0 | +0.9 | |
| Labour | William House | 3,579 | 27.9 | New | |
| Majority | 1,550 | 12.1 | −29.7 | ||
| Turnout | 12,811 | 88.0 | +6.0 | ||
| Registered electors | 14,552 | ||||
| Liberal hold | Swing | −14.9 | |||
| Party | Candidate | Votes | % | ±% | |
|---|---|---|---|---|---|
| Liberal | Henry Havelock-Allan | 4,531 | 37.6 | -4.5 | |
| Labour | William House | 3,993 | 33.2 | +5.3 | |
| Conservative | Gervase Edward Markham | 3,519 | 29.2 | −0.8 | |
| Majority | 538 | 4.4 | −7.7 | ||
| Turnout | 12,043 | 82.8 | −5.2 | ||
| Registered electors | 14,552 | ||||
| Liberal hold | Swing | −4.9 | |||
General Election 1914–15:
Another General Election was required to take place before the end of 1915. The political parties had been making preparations for an election to take place and by July 1914, the following candidates had been selected;
- Liberal: Vickerman Rutherford
- Unionist: Richard George Tyndall Bright[39]
- Labour: Ben Spoor
See also
Notes
References
- "Bishop Auckland: Usual Resident Population, 2011". Neighbourhood Statistics. Office for National Statistics. Archived from the original on 14 December 2019. Retrieved 30 January 2015.
- "Electorate Figures – Boundary Commission for England". 2011 Electorate Figures. Boundary Commission for England. 4 March 2011. Archived from the original on 6 November 2010. Retrieved 13 March 2011.
- "Local statistics – Office for National Statistics". www.ons.gov.uk. Archived from the original on 18 October 2019. Retrieved 6 October 2019.
- "Ordnance Survey map, courtesy of English Heritage". Archived from the original on 24 April 2012.
- "Redistribution of Seats Act 1885". pp. 155–156.
- "HMSO Boundary Commission Report 1885, Durham".
- Craig, Fred W. S. (1972). Boundaries of parliamentary constituencies 1885-1972;. Chichester: Political Reference Publications. p. 10. ISBN 0-900178-09-4. OCLC 539011.
- "Representation of the People Act 1918". p. 496.
- Craig, Fred W. S. (1972). Boundaries of parliamentary constituencies 1885-1972;. Chichester: Political Reference Publications. p. 58. ISBN 0-900178-09-4. OCLC 539011.
- Craig, Fred W. S. (1972). Boundaries of parliamentary constituencies 1885-1972;. Chichester: Political Reference Publications. p. 129. ISBN 0-900178-09-4. OCLC 539011.
- "The Parliamentary Constituencies (England) Order 1983" (PDF). p. 22.
- "The Parliamentary Constituencies (England) Order 1995". In the County of Durham.
- "The Parliamentary Constituencies (England) Order 2007". In Durham and Darlington.
- Leigh Rayment's Historical List of MPs – Constituencies beginning with "B" (part 3)
- Collins, Terry (14 November 2019). "Statement of persons nominated, notice of poll and situation of polling stations. Election of a Member of Parliament for Bishop Auckland Constituency" (PDF). Durham County Council. Archived from the original (PDF) on 15 November 2019. Retrieved 15 November 2019.
- "Commons Briefing Paper 8749. General Election 2019: results and analysis" (PDF). London: House of Commons Library. 28 January 2020. Archived (PDF) from the original on 18 November 2021. Retrieved 19 January 2022.
- Collins, Terry (17 May 2017). "Statement of persons nominated, notice of poll and situation of polling stations. Election of a Member of Parliament for Bishop Auckland Constituency" (PDF). Durham County Council. Archived (PDF) from the original on 26 June 2017. Retrieved 13 May 2017.
- "Commons Briefing Paper 7979. General Election 2017: results and analysis" (PDF) (Second ed.). House of Commons Library. 29 January 2019 [7 April 2018]. Archived (PDF) from the original on 12 November 2019.
- "General election 2017: latest updates". BBC News. Archived from the original on 12 June 2020. Retrieved 21 June 2018.
- "Election Data 2015". Electoral Calculus. Archived from the original on 17 October 2015. Retrieved 17 October 2015.
- "Bishop Auckland". BBC News. Archived from the original on 13 December 2019. Retrieved 15 May 2015.
- "Election Data 2010". Electoral Calculus. Archived from the original on 26 July 2013. Retrieved 17 October 2015.
- http://www.durham.gov.uk/PDFApproved/ParliamentaryElection2010_SoPN_BA.pdf%5B%5D
- "Election Data 2005". Electoral Calculus. Archived from the original on 15 October 2011. Retrieved 18 October 2015.
- "Election Data 2001". Electoral Calculus. Archived from the original on 15 October 2011. Retrieved 18 October 2015.
- "Election Data 1997". Electoral Calculus. Archived from the original on 15 October 2011. Retrieved 18 October 2015.
- "Election Data 1992". Electoral Calculus. Archived from the original on 15 October 2011. Retrieved 18 October 2015.
- "Politics Resources". Election 1992. Politics Resources. 9 April 1992. Archived from the original on 24 July 2011. Retrieved 6 December 2010.
- "Election Data 1987". Electoral Calculus. Archived from the original on 15 October 2011. Retrieved 18 October 2015.
- "Election Data 1983". Electoral Calculus. Archived from the original on 15 October 2011. Retrieved 18 October 2015.
- Political Science Resources, Richard Kimber
- British parliamentary election results 1918–1949, Fred W. S. Craig Parliamentary Research Services, 1983
- British Parliamentary Election Results 1918–49, FWS Craig
- British Parliamentary Election Results 1885–1918, FWS Craig
- The Liberal Year Book, 1907
- Debrett's House of Commons & Judicial Bench, 1886
- Debrett's House of Commons & Judicial Bench, 1901
- Debrett's House of Commons & Judicial Bench, 1916
- Newcastle Journal 14 May 1914
Sources
- Craig, F. W. S. (1983) [1969]. British parliamentary election results 1918–1949 (3rd ed.). Chichester: Parliamentary Research Services. ISBN 0-900178-06-X.