2022 Gateshead Metropolitan Borough Council election
The 2022 Gateshead Metropolitan Borough Council election took place on 5 May 2022. One third of councillors — 22 out of 66 — on Gateshead Metropolitan Borough Council were elected. The election took place alongside other local elections across the United Kingdom.
| ||||||||||||||||||||||||||||||||||
22 out of 66 seats to Gateshead Metropolitan Borough Council 34 seats needed for a majority | ||||||||||||||||||||||||||||||||||
|---|---|---|---|---|---|---|---|---|---|---|---|---|---|---|---|---|---|---|---|---|---|---|---|---|---|---|---|---|---|---|---|---|---|---|
| ||||||||||||||||||||||||||||||||||
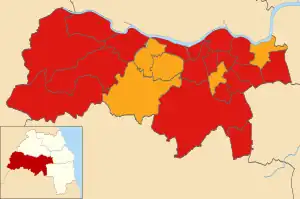
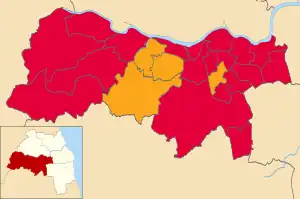
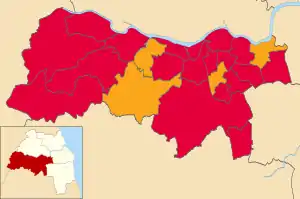
 Winner of each seat at the 2022 Gateshead Metropolitan Borough Council election | ||||||||||||||||||||||||||||||||||
| ||||||||||||||||||||||||||||||||||
In the previous council election in 2021, the Labour Party maintained its longstanding control of the council, holding 52 seats after the election with thirteen Liberal Democrats and one independent.
Background


The Local Government Act 1972 created a two-tier system of metropolitan counties and districts covering Greater Manchester, Merseyside, South Yorkshire, Tyne and Wear, the West Midlands, and West Yorkshire starting in 1974. Gateshead was a district of the Tyne and Wear metropolitan county.[1] The Local Government Act 1985 abolished the metropolitan counties, with metropolitan districts taking on most of their powers as metropolitan boroughs.
Gateshead Council has continuously been under Labour control since its creation. The Liberal Democrats have generally been the main opposition. In the most recent election in 2021, Labour won 19 seats on 46.8% of the vote and the Liberal Democrats won 5 seats on 20.6% of the vote. The Conservatives received 22.5% of the vote and the Green Party received 8.6% of the vote, but neither party won any seats.[2]
Positions up for election in 2022 were last election in 2018. In that election, Labour won 19 seats and the Liberal Democrats won four seats.[3]
Electoral process
The council elects its councillors in thirds, with a third being up for election every year for three years, with no election in the fourth year.[4][5] The election will take place by first-past-the-post voting, with wards generally being represented by three councillors, with one elected in each election year to serve a four-year term.
All registered electors (British, Irish, Commonwealth and European Union citizens) living in Gateshead aged 18 or over will be entitled to vote in the election. People who live at two addresses in different councils, such as university students with different term-time and holiday addresses, are entitled to be registered for and vote in elections in both local authorities. Voting in-person at polling stations will take place from 07:00 to 22:00 on election day, and voters will be able to apply for postal votes or proxy votes in advance of the election.
Previous council composition
| After 2021 election | Before 2022 election | ||||
|---|---|---|---|---|---|
| Party | Seats | Party | Seats | ||
| Labour | 52 | Labour | 52 | ||
| Liberal Democrats | 13 | Liberal Democrats | 13 | ||
| Independent | 1 | Independent | 1 | ||
Results summary
| 2022 Gateshead Metropolitan Borough Council election | ||||||||||
|---|---|---|---|---|---|---|---|---|---|---|
| Party | This election | Full council | This election | |||||||
| Seats | Net | Seats % | Other | Total | Total % | Votes | Votes % | +/− | ||
| Labour | 17 | 77.3 | 34 | 51 | 77.3 | 25,059 | 49.9 | |||
| Liberal Democrats | 5 | 22.7 | 10 | 15 | 22.7 | 12,305 | 24.5 | |||
| Conservative | 0 | 0.0 | 0 | 0 | 0.0 | 8,306 | 16.5 | |||
| Green | 0 | 0.0 | 0 | 0 | 0.0 | 4,104 | 8.2 | |||
| TUSC | 0 | 0.0 | 0 | 0 | 0.0 | 315 | 0.6 | |||
| Save Us Now | 0 | 0.0 | 0 | 0 | 0.0 | 63 | 0.1 | |||
| Independent | 0 | 0.0 | 0 | 0 | 0.0 | 60 | 0.1 | |||
Results by ward
An asterisk indicates an incumbent councillor.
Birtley
| Party | Candidate | Votes | % | ±% | |
|---|---|---|---|---|---|
| Labour | Daniel Weatherley | 984 | 46.4 | ||
| Liberal Democrats | Paul Elliott | 906 | 42.8 | ||
| Conservative | Richard Herdman | 229 | 10.8 | ||
| Majority | 78 | 3.6 | |||
| Turnout | 2,128 | 34.7 | |||
| Labour hold | Swing | ||||
Blaydon
| Party | Candidate | Votes | % | ±% | |
|---|---|---|---|---|---|
| Labour | Lee-Ann Moir | 1,087 | 52.9 | ||
| Conservative | Susan Wilson | 589 | 28.7 | ||
| Green | Ruth Ashford | 230 | 11.2 | ||
| Liberal Democrats | Kamil Tankiewicz | 149 | 7.3 | ||
| Majority | 498 | 24.2 | |||
| Turnout | 2,072 | 29.1 | |||
| Labour hold | Swing | ||||
Bridges
| Party | Candidate | Votes | % | ±% | |
|---|---|---|---|---|---|
| Labour | Angela Douglas* | 1,013 | 65.9 | ||
| Conservative | Martin Backley | 271 | 17.6 | ||
| Liberal Democrats | Gareth Cooper | 253 | 16.5 | ||
| Majority | 742 | 48.3 | |||
| Turnout | 1,554 | 27.2 | |||
| Labour hold | Swing | ||||
Chopwell and Rowlands Gill
| Party | Candidate | Votes | % | ±% | |
|---|---|---|---|---|---|
| Labour | Lynne Caffrey* | 1,648 | 61.7 | ||
| Conservative | Brian Derrick | 520 | 19.5 | ||
| Green | John Aspinall | 311 | 11.7 | ||
| Liberal Democrats | Jean Callender | 190 | 7.1 | ||
| Majority | 1,128 | 42.2 | |||
| Turnout | 2,676 | 40.0 | |||
| Labour hold | Swing | ||||
Chowdene
| Party | Candidate | Votes | % | ±% | |
|---|---|---|---|---|---|
| Labour | Maureen Goldsworthy* | 1,248 | 55.1 | ||
| Conservative | David Potts | 463 | 20.4 | ||
| Liberal Democrats | Norman Spours | 314 | 13.9 | ||
| Green | Thomas Newell | 175 | 7.7 | ||
| TUSC | Marika Smith | 66 | 2.9 | ||
| Majority | 785 | 34.7 | |||
| Turnout | 2,273 | 34.3 | |||
| Labour hold | Swing | ||||
Crawcrook and Greenside
| Party | Candidate | Votes | % | ±% | |
|---|---|---|---|---|---|
| Labour | Hugh Kelly* | 1,324 | 45.4 | ||
| Green | Jack Philipson | 913 | 31.3 | ||
| Conservative | Christopher Coxon | 502 | 17.2 | ||
| Liberal Democrats | Oliver Jones-Lyons | 177 | 6.1 | ||
| Majority | 411 | 14.1 | |||
| Turnout | 2,922 | 41.2 | |||
| Labour hold | Swing | ||||
Deckham
| Party | Candidate | Votes | % | ±% | |
|---|---|---|---|---|---|
| Labour | Martin Gannon* | 1,165 | 59.9 | ||
| Conservative | Josh Knotts | 332 | 17.1 | ||
| Green | Gary Rutherford Brooks | 200 | 10.3 | ||
| Liberal Democrats | Matthew Jordison | 173 | 8.9 | ||
| TUSC | Norman Hall | 75 | 3.9 | ||
| Majority | 833 | 42.8 | |||
| Turnout | 1,956 | 31.0 | |||
| Labour hold | Swing | ||||
Dunston and Teams
| Party | Candidate | Votes | % | ±% | |
|---|---|---|---|---|---|
| Labour | Dot Burnett* | 1,057 | 61.5 | ||
| Conservative | Jordan-Lee Guthrie | 303 | 17.6 | ||
| Green | Andy Blanchflower | 207 | 12.0 | ||
| Liberal Democrats | Beth Gordon | 151 | 8.8 | ||
| Majority | 754 | 43.9 | |||
| Turnout | 1,722 | 28.1 | |||
| Labour hold | Swing | ||||
Dunston Hill and Whickham East
| Party | Candidate | Votes | % | ±% | |
|---|---|---|---|---|---|
| Liberal Democrats | Amelia Ord | 1,232 | 48.7 | ||
| Labour | Andrew Moir | 809 | 32.0 | ||
| Conservative | Jak Hocking | 286 | 11.3 | ||
| Green | Isabel Blanchflower | 157 | 6.2 | ||
| Save Us Now | Graham Steele | 46 | 1.8 | ||
| Majority | 423 | 16.7 | |||
| Turnout | 2,533 | 38.5 | |||
| Liberal Democrats hold | Swing | ||||
Felling
| Party | Candidate | Votes | % | ±% | |
|---|---|---|---|---|---|
| Labour | Bill Dick* | 932 | 59.4 | ||
| Conservative | Peter Jackson | 263 | 16.8 | ||
| Liberal Democrats | David Fawcett | 236 | 15.0 | ||
| Green | Neil Grant | 138 | 8.8 | New | |
| Majority | 669 | 42.6 | |||
| Turnout | 1,572 | 28.3 | |||
| Labour hold | Swing | ||||
High Fell
| Party | Candidate | Votes | % | ±% | |
|---|---|---|---|---|---|
| Labour | Judith Gibson* | 991 | 58.1 | ||
| Liberal Democrats | Thomas Holder | 284 | 16.7 | ||
| Conservative | Francis Athey | 245 | 14.4 | ||
| TUSC | Elaine Brunskill | 117 | 6.9 | ||
| Green | Gabriel Rubinstein | 68 | 4.0 | New | |
| Majority | 707 | 41.4 | |||
| Turnout | 1,705 | 28.4 | |||
| Labour hold | Swing | ||||
Lamesley
| Party | Candidate | Votes | % | ±% | |
|---|---|---|---|---|---|
| Labour | Jane McCoid* | 1,340 | 57.8 | ||
| Conservative | Sheila Everatt | 605 | 26.1 | ||
| Liberal Democrats | Daniel Clarke | 203 | 8.8 | ||
| Green | Ashleigh McLean | 169 | 7.3 | New | |
| Majority | 735 | 31.7 | |||
| Turnout | 2,325 | 32.2 | |||
| Labour hold | Swing | ||||
Lobley Hill and Bensham
| Party | Candidate | Votes | % | ±% | |
|---|---|---|---|---|---|
| Labour | Kevin Dodds* | 1,274 | 59.3 | ||
| Conservative | John Gardiner | 395 | 18.4 | ||
| Liberal Democrats | Jamie Rickelton | 247 | 11.5 | ||
| Green | Andy Redfern | 234 | 10.9 | ||
| Majority | 879 | 40.9 | |||
| Turnout | 2,164 | 31.5 | |||
| Labour hold | Swing | ||||
Low Fell
| Party | Candidate | Votes | % | ±% | |
|---|---|---|---|---|---|
| Liberal Democrats | Dawn Welsh | 1,549 | 48.3 | ||
| Labour | Calvin Lawson | 1,179 | 36.8 | ||
| Conservative | Paul Sterling | 262 | 8.2 | ||
| Green | Mark Gorman | 217 | 6.8 | ||
| Majority | 370 | 11.5 | |||
| Turnout | 3,217 | 46.7 | |||
| Liberal Democrats hold | Swing | ||||
Pelaw and Heworth
| Party | Candidate | Votes | % | ±% | |
|---|---|---|---|---|---|
| Liberal Democrats | Amanda Wintcher | 1,255 | 52.3 | ||
| Labour | Anne Wheeler | 995 | 41.5 | ||
| Conservative | Ali Pargam | 149 | 6.2 | ||
| Majority | 260 | 10.8 | |||
| Turnout | 2,412 | 37.5 | |||
| Liberal Democrats gain from Labour | Swing | ||||
Ryton, Crookhill and Stella
| Party | Candidate | Votes | % | ±% | |
|---|---|---|---|---|---|
| Labour | Freda Geddes* | 1,650 | 59.7 | ||
| Conservative | Louise Prince | 452 | 16.4 | ||
| Green | Andrew Mason | 336 | 12.2 | ||
| Liberal Democrats | Lynda Duggan | 267 | 9.7 | ||
| TUSC | Ros Cooper | 57 | 2.1 | ||
| Majority | 1,198 | 43.3 | |||
| Turnout | 2,776 | 40.4 | |||
| Labour hold | Swing | ||||
Saltwell
| Party | Candidate | Votes | % | ±% | |
|---|---|---|---|---|---|
| Labour | John Adams* | 984 | 48.6 | ||
| Liberal Democrats | Leanne Brand | 771 | 38.1 | ||
| Conservative | Robert Ableson | 191 | 9.4 | ||
| Independent | Rachel Mary Cabral | 60 | 3.0 | New | |
| Save Us Now | Craig Gallagher | 17 | 0.8 | New | |
| Majority | 213 | 10.5 | |||
| Turnout | 2,032 | 33.6 | |||
| Labour hold | Swing | ||||
Wardley and Leam Lane
| Party | Candidate | Votes | % | ±% | |
|---|---|---|---|---|---|
| Labour | Sharron Potts | 1,275 | 61.9 | ||
| Conservative | John McNeil | 395 | 19.2 | ||
| Liberal Democrats | Robinson Stanaway | 203 | 9.8 | ||
| Green | Alan Price | 188 | 9.1 | ||
| Majority | 880 | 42.7 | |||
| Turnout | 2,072 | 34.8 | |||
| Labour hold | Swing | ||||
Whickham North
| Party | Candidate | Votes | % | ±% | |
|---|---|---|---|---|---|
| Liberal Democrats | Peter Craig* | 1,510 | 61.1 | ||
| Labour | Jeff Bowe | 707 | 28.6 | ||
| Conservative | John Callanan | 255 | 10.3 | ||
| Majority | 803 | 32.5 | |||
| Turnout | 2,479 | 40.1 | |||
| Liberal Democrats hold | Swing | ||||
Whickham South and Sunniside
| Party | Candidate | Votes | % | ±% | |
|---|---|---|---|---|---|
| Liberal Democrats | Marilynn Ord* | 1,770 | 60.1 | ||
| Labour | Michael Hall | 695 | 23.6 | ||
| Conservative | Perry Wilson | 346 | 11.7 | ||
| Green | Helen McDonald | 136 | 4.6 | New | |
| Majority | 1,075 | 36.5 | |||
| Turnout | 2,955 | 45.0 | |||
| Liberal Democrats hold | Swing | ||||
Windy Nook and Whitehills
| Party | Candidate | Votes | % | ±% | |
|---|---|---|---|---|---|
| Labour | Tom Graham* | 1,259 | 58.8 | ||
| Conservative | Kyle Murray | 430 | 20.1 | ||
| Liberal Democrats | Susan Walker | 315 | 14.7 | ||
| Green | Ruth Grant | 137 | 6.4 | New | |
| Majority | 829 | 38.7 | |||
| Turnout | 2,156 | 30.9 | |||
| Labour hold | Swing | ||||
Winlaton and High Spen
| Party | Candidate | Votes | % | ±% | |
|---|---|---|---|---|---|
| Labour | Pamela Burns* | 1,443 | 53.4 | ||
| Conservative | Lewis Ormston | 823 | 30.4 | ||
| Green | Paul McNally | 288 | 10.7 | ||
| Liberal Democrats | David Randall | 150 | 5.5 | ||
| Majority | 620 | 23.0 | |||
| Turnout | 2,709 | 39.9 | |||
| Labour hold | Swing | ||||
References
- Local Government in England and Wales: A Guide to the New System. London: HMSO. 1974. p. 7. ISBN 0-11-750847-0.
- Soden, Herbert (14 April 2021). "Gateshead Council 2021 local election results in full". ChronicleLive. Retrieved 26 March 2022.
- "Local election results 2018". Gateshead Council. Retrieved 28 March 2022.
- "Local government structure and elections". GOV.UK. Retrieved 27 April 2018.
- "Election Timetable in England" (PDF).
- "Candidates standing for election" (PDF). Gateshead Metropolitan Borough Council. Retrieved 12 April 2022.