2006 Wolverhampton City Council election
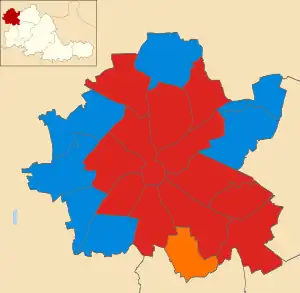
Elections to Wolverhampton City Council were held on 3 May 2006 in Wolverhampton, England. One third of the council was up for election and the Labour Party kept overall control of the council.
Prior to the election, the composition of the council was
After the election, the composition of the council was
Election result
| Party | Candidate | Votes | % | ±% | |
|---|---|---|---|---|---|
| Labour | Stephen Simkins | 1185 | 43.41 | ||
| Conservative | Ann Modi | 710 | 26.01 | ||
| Independent | Tom Fellows | 600 | 21.98 | ||
| Liberal Democrats | Roger Gray | 217 | 7.95 | ||
| Majority | 475 | 17.40 | |||
| Turnout | 2,730 | 29.68 | |||
| Labour hold | Swing | ||||
| Party | Candidate | Votes | % | ±% | |
|---|---|---|---|---|---|
| Labour | Philip Page | 1318 | 43.13 | ||
| Conservative | Gill Fellows | 970 | 31.74 | ||
| UKIP | Kevin Simmons | 325 | 10.63 | ||
| Liberal Democrats | Frances Heap | 242 | 7.92 | ||
| Green | Eddie Clarke | 195 | 6.38 | ||
| Majority | 348 | 11.39 | |||
| Turnout | 3,056 | 33.87 | |||
| Labour hold | Swing | ||||
| Party | Candidate | Votes | % | ±% | |
|---|---|---|---|---|---|
| Labour | Judith Rowley | 2314 | 71.20 | ||
| Conservative | John Corns | 625 | 19.23 | ||
| Liberal Democrats | Edward Pringle | 292 | 8.98 | ||
| Majority | 1689 | 51.97 | |||
| Turnout | 3,250 | 37.58 | |||
| Labour hold | Swing | ||||
| Party | Candidate | Votes | % | ±% | |
|---|---|---|---|---|---|
| Conservative | Neville Patten | 1571 | 47.06 | ||
| Labour | Paul Allen | 1154 | 34.57 | ||
| Liberal Democrats | James Lindly | 569 | 17.05 | ||
| Majority | 417 | 12.49 | |||
| Turnout | 3,338 | 37.00 | |||
| Conservative gain from Labour | Swing | ||||
| Party | Candidate | Votes | % | ±% | |
|---|---|---|---|---|---|
| Labour | Paul Sweet | 1187 | 55.60 | ||
| Conservative | Andrew Dawson | 562 | 26.32 | ||
| Liberal Democrats | Ian Jenkins | 364 | 17.05 | ||
| Majority | 625 | 29.27 | |||
| Turnout | 2,135 | 23.62 | |||
| Labour hold | Swing | ||||
| Party | Candidate | Votes | % | ±% | |
|---|---|---|---|---|---|
| Labour | Keith Inston | 1351 | 52.45 | ||
| Conservative | Peter Dobb | 733 | 28.45 | ||
| Liberal Democrats | Ann Whitehouse | 472 | 18.32 | ||
| Majority | 618 | 23.99 | |||
| Turnout | 2,576 | 28.83 | |||
| Labour hold | Swing | ||||
| Party | Candidate | Votes | % | ±% | |
|---|---|---|---|---|---|
| Labour | Andrew Johnson | 1860 | 64.03 | ||
| Conservative | Brian Fellows | 581 | 20.00 | ||
| Liberal Democrats | Eileen Birch | 444 | 15.28 | ||
| Majority | 1279 | 44.03 | |||
| Turnout | 2,905 | 30.49 | |||
| Labour hold | Swing | ||||
| Party | Candidate | Votes | % | ±% | |
|---|---|---|---|---|---|
| Labour | Steven Evans | 1488 | 47.03 | ||
| Conservative | Carol Bourne | 1159 | 36.63 | ||
| Liberal Democrats | Stephen Birch | 496 | 15.68 | ||
| Majority | 329 | 10.40 | |||
| Turnout | 3,164 | 35.45 | |||
| Labour hold | Swing | ||||
| Party | Candidate | Votes | % | ±% | |
|---|---|---|---|---|---|
| Labour | Man Mohan Passi | 2033 | 51.30 | ||
| Conservative | John Mellor | 1440 | 36.34 | ||
| Liberal Democrats | Bryan Lewis | 472 | 11.91 | ||
| Majority | 593 | 14.96 | |||
| Turnout | 3,963 | 44.04 | |||
| Labour hold | Swing | ||||
| Party | Candidate | Votes | % | ±% | |
|---|---|---|---|---|---|
| Labour | Caroline Siarkiewicz | 937 | 42.61 | ||
| Liberal | Colin Hallmark | 489 | 22.24 | ||
| Conservative | Lucinda Turner | 484 | 22.01 | ||
| Liberal Democrats | David Jack | 274 | 12.46 | ||
| Majority | 448 | 20.37 | |||
| Turnout | 2,199 | 28.43 | |||
| Labour hold | Swing | ||||
| Party | Candidate | Votes | % | ±% | |
|---|---|---|---|---|---|
| Conservative | Christine Mills | 2306 | 60.16 | ||
| Labour | Jagnandan Ghera | 849 | 22.15 | ||
| Liberal Democrats | Jessica Pringle | 639 | 16.67 | ||
| Majority | 1457 | 38.01 | |||
| Turnout | 3,833 | 40.85 | |||
| Conservative hold | Swing | ||||
| Party | Candidate | Votes | % | ±% | |
|---|---|---|---|---|---|
| Labour | George Lockett | 1335 | 48.37 | ||
| Conservative | Ian Lucas | 1013 | 36.70 | ||
| Liberal Democrats | John Steatham | 400 | 14.49 | ||
| Majority | 322 | 11.67 | |||
| Turnout | 2,760 | 30.02 | |||
| Labour hold | Swing | ||||
| Party | Candidate | Votes | % | ±% | |
|---|---|---|---|---|---|
| Labour | Manohar Minhas | 1405 | 36.61 | ||
| Liberal Democrats | Robin Lawrence | 1277 | 33.27 | ||
| Conservative | Martin Berrington | 1129 | 29.42 | ||
| Majority | 128 | 3.34 | |||
| Turnout | 3,838 | 44.74 | |||
| Labour hold | Swing | ||||
| Party | Candidate | Votes | % | ±% | |
|---|---|---|---|---|---|
| Conservative | Patricia Patten | 2503 | 56.69 | ||
| Labour | Ricky Chima | 1191 | 36.98 | ||
| Liberal Democrats | June Hemsley | 686 | 15.54 | ||
| Majority | 1312 | 29.72 | |||
| Turnout | 4,415 | 44.05 | |||
| Conservative hold | Swing | ||||
| Party | Candidate | Votes | % | ±% | |
|---|---|---|---|---|---|
| Liberal | Malcolm Gwinnett | 1106 | 34.27 | ||
| Labour | William Langford | 904 | 28.01 | ||
| Liberal Democrats | Sandra Terry | 785 | 24.33 | ||
| Conservative | Robert Green | 408 | 12.64 | ||
| Majority | 202 | 6.26 | |||
| Turnout | 3,227 | 37.00 | |||
| Liberal gain from Liberal Democrats | Swing | ||||
| Party | Candidate | Votes | % | ±% | |
|---|---|---|---|---|---|
| Labour | Tersaim Singh | 1311 | 62.40 | ||
| Liberal Democrats | Alexandra Lawrence | 408 | 19.42 | ||
| Conservative | Lionel Berry | 372 | 17.71 | ||
| Majority | 903 | 42.98 | |||
| Turnout | 2,101 | 28.82 | |||
| Labour hold | Swing | ||||
| Party | Candidate | Votes | % | ±% | |
|---|---|---|---|---|---|
| Conservative | Barry Findlay | 2654 | 66.95 | ||
| Labour | David Hartley | 746 | 18.82 | ||
| Liberal Democrats | Colin Ross | 541 | 13.65 | ||
| Majority | 1908 | 48.13 | |||
| Turnout | 3,964 | 43.09 | |||
| Conservative hold | Swing | ||||
| Party | Candidate | Votes | % | ±% | |
|---|---|---|---|---|---|
| Conservative | Andrew Wynne | 3197 | 73.73 | ||
| Labour | Muhammad Khan | 588 | 13.56 | ||
| Liberal Democrats | Philip Bennett | 527 | 12.15 | ||
| Majority | 2609 | 60.17 | |||
| Turnout | 4,336 | 47.16 | |||
| Conservative hold | Swing | ||||
| Party | Candidate | Votes | % | ±% | |
|---|---|---|---|---|---|
| Conservative | David Bourne | 1225 | 30.83 | ||
| Labour | Gwendoline Stafford Good | 1157 | 29.12 | ||
| BNP | Dennis Organ | 1016 | 25.57 | ||
| Independent | Arthur Newman | 563 | 14.17 | ||
| Majority | 68 | 1.71 | |||
| Turnout | 3,973 | 44.00 | |||
| Conservative gain from Independent | Swing | ||||
| Party | Candidate | Votes | % | ±% | |
|---|---|---|---|---|---|
| Conservative | Matthew Holdcroft | 1555 | 48.04 | ||
| Labour | Paul Kalinauckas | 1194 | 36.89 | ||
| Liberal Democrats | Carole Jenkins | 262 | 8.09 | ||
| Green | Stuart Hinde | 212 | 6.55 | ||
| Majority | 361 | 11.15 | |||
| Turnout | 3,237 | 37.53 | |||
| Conservative hold | Swing | ||||
Number of candidates
Of the main political parties, both the Conservative Party and Labour Party fielded a full slate of 20 candidates each.
The Liberal Democrats fielded 19 candidates, failing to have a candidate in place in Wednesfield North.
One independent candidate stood in each of the following 2 wards:
- Bilston East
- Wednesfield North
The Green Party had a candidate in each of the following 2 wards:
- Bilston North
- Wednesfield South
The British National Party fielded only 1 candidate, in Wednesfield North ward.
The Liberal Party stood in only one ward, Heath Town.
| Birmingham | |
|---|---|
| Coventry | |
| Dudley | |
| Sandwell | |
| Solihull | |
| Walsall | |
| Wolverhampton | |
| West Midlands County Council |
|
| Mayor | |
| |