2004 Derby City Council election
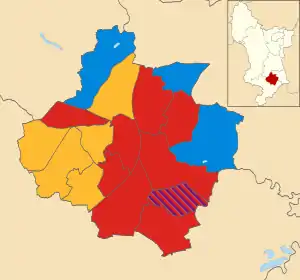
The 2004 Derby City Council election took place on 10 June 2004 to elect members of Derby City Council in England. One third of the council was up for election and the council stayed under no overall control.[1]
| |||||||||||||||||||||||||||||||||||||||||||||||||||||
17 of 51 seats to Derby City Council 26 seats needed for a majority | |||||||||||||||||||||||||||||||||||||||||||||||||||||
|---|---|---|---|---|---|---|---|---|---|---|---|---|---|---|---|---|---|---|---|---|---|---|---|---|---|---|---|---|---|---|---|---|---|---|---|---|---|---|---|---|---|---|---|---|---|---|---|---|---|---|---|---|---|
| |||||||||||||||||||||||||||||||||||||||||||||||||||||
 | |||||||||||||||||||||||||||||||||||||||||||||||||||||
The results saw the Labour Party gain a seat from the Conservatives but lose one to the Liberal Democrats.[2] They also saw Frank Leeming from the United Kingdom Independence Party win the party's first council seat in Derby,[3] gaining a seat that had formerly been held by independent, Ron Allen, who had died in March.[2] Leeming was expected to hold the balance of power on the council between Labour and a Liberal Democrat/Conservative alliance depending on the outcome of a by-election in July.[2]
After the election, the composition of the council was:
- Labour 24
- Liberal Democrat 14
- Conservative 11
- United Kingdom Independence Party 1
- Vacant 1[4][5]
Election result
| Party | Seats | Gains | Losses | Net gain/loss | Seats % | Votes % | Votes | +/− | |
|---|---|---|---|---|---|---|---|---|---|
| Labour | 9 | 1 | 1 | 50.0 | 32.2 | 25,794 | |||
| Liberal Democrats | 5 | 1 | 0 | 27.8 | 28.9 | 23,098 | |||
| Conservative | 3 | 0 | 1 | 16.7 | 27.8 | 22,214 | |||
| UKIP | 1 | 1 | 0 | 5.6 | 9.3 | 7,419 | |||
| Independent | 0 | 0 | 1 | 0 | 0.9 | 743 | |||
| Respect | 0 | 0 | 0 | 0 | 0 | 0.9 | 701 | ||
| Monster Raving Loony | 0 | 0 | 0 | 0 | 0 | 0.1 | 78 | ||
Ward results
Abbey

| Party | Candidate | Votes | % | ±% | |
|---|---|---|---|---|---|
| Liberal Democrats | Ann Jackman | 1,558 | 42.4 | -10.1 | |
| Labour | Lisa Higginbottom | 1,054 | 28.7 | -3.6 | |
| UKIP | Margaret Rooney | 530 | 14.4 | +14.4 | |
| Conservative | Douglas Sice | 455 | 12.4 | +0.7 | |
| Monster Raving Loony | Craig Reynolds | 78 | 2.1 | +2.1 | |
| Majority | 504 | 13.7 | -6.5 | ||
| Turnout | 3,675 | 41.9 | +16.3 | ||
| Liberal Democrats hold | Swing | ||||
Allestree
| Party | Candidate | Votes | % | ±% | |
|---|---|---|---|---|---|
| Conservative | Philip Hickson | 2,879 | 45.4 | -5.3 | |
| Labour | Margot Keats | 1,246 | 19.7 | -4.6 | |
| UKIP | Ronald McKeown | 1,174 | 18.5 | +18.5 | |
| Liberal Democrats | Roger Jackson | 1,038 | 16.4 | -8.6 | |
| Majority | 1,633 | 25.7 | +0.0 | ||
| Turnout | 6,337 | 60.4 | +21.3 | ||
| Conservative hold | Swing | ||||
Alvaston
| Party | Candidate | Votes | % | ±% | |
|---|---|---|---|---|---|
| Labour | Alan Graves | 1,638 | 40.1 | -7.4 | |
| UKIP | Martin Bardoe | 1,123 | 27.5 | +27.5 | |
| Conservative | Simon Hart | 702 | 17.2 | -3.5 | |
| Liberal Democrats | Lorraine Brown | 618 | 15.1 | -0.6 | |
| Majority | 515 | 12.6 | -14.2 | ||
| Turnout | 4,081 | 41.3 | +16.3 | ||
| Labour hold | Swing | ||||
Arboretum
| Party | Candidate | Votes | % | ±% | |
|---|---|---|---|---|---|
| Labour | Shiraz Khan | 2,055 | 45.6 | +0.8 | |
| Liberal Democrats | Rehmet Kham | 1,791 | 39.7 | +16.9 | |
| Conservative | Joan Magee | 660 | 14.6 | -5.9 | |
| Majority | 264 | 5.9 | -16.1 | ||
| Turnout | 4,506 | 49.4 | +23.3 | ||
| Labour hold | Swing | ||||
Blagreaves
| Party | Candidate | Votes | % | ±% | |
|---|---|---|---|---|---|
| Liberal Democrats | Sean Marshall | 2,617 | 55.1 | -2.4 | |
| Labour | Prem Shukla | 1,268 | 26.7 | +1.1 | |
| Conservative | David Jennings | 867 | 18.2 | +3.1 | |
| Majority | 1,349 | 28.4 | -3.5 | ||
| Turnout | 4,752 | 52.2 | +15.5 | ||
| Liberal Democrats hold | Swing | ||||
Boulton
| Party | Candidate | Votes | % | ±% | |
|---|---|---|---|---|---|
| UKIP | Graham Leeming | 1,781 | |||
| Labour | Barbara Jackson | 1,452 | |||
| Labour | Alan Mullarkey | 1,237 | |||
| UKIP | Paul Roome | 1,163 | |||
| Conservative | Sean Conway | 870 | |||
| Conservative | Valerie Clare | 585 | |||
| Liberal Democrats | Wendy Harbon | 353 | |||
| Liberal Democrats | Eric Ashburner | 342 | |||
| Turnout | 7,783 | 45.6 | +14.3 | ||
| UKIP gain from Independent | Swing | ||||
| Labour hold | Swing | ||||
Chaddesden
| Party | Candidate | Votes | % | ±% | |
|---|---|---|---|---|---|
| Labour | John Ahern | 1,929 | 43.2 | -6.0 | |
| Conservative | Vincent Mills | 1,646 | 36.8 | +4.3 | |
| Liberal Democrats | Leslie Alcock | 699 | 15.6 | +0.7 | |
| Independent | Charles McLynn | 196 | 4.4 | +1.0 | |
| Majority | 283 | 6.4 | -10.3 | ||
| Turnout | 4,470 | 48.2 | +18.6 | ||
| Labour hold | Swing | ||||
Chellaston
| Party | Candidate | Votes | % | ±% | |
|---|---|---|---|---|---|
| Labour | Mark Tittley | 1,972 | 41.3 | ||
| Conservative | Julie Hickson | 1,381 | 28.9 | ||
| UKIP | David Black | 1,012 | 21.2 | ||
| Liberal Democrats | Christine Yates | 414 | 8.7 | ||
| Majority | 391 | 12.4 | |||
| Turnout | 4,779 | 50.7 | +16.5 | ||
| Labour gain from Conservative | Swing | ||||
Darley
| Party | Candidate | Votes | % | ±% | |
|---|---|---|---|---|---|
| Liberal Democrats | Finbar Richards | 1,636 | 38.7 | -3.2 | |
| Labour | Michael Futers | 1,320 | 31.2 | +2.2 | |
| Conservative | Christopher Charlesworth | 1,276 | 30.2 | +4.1 | |
| Majority | 316 | 7.5 | -5.4 | ||
| Turnout | 4,232 | 48.4 | +13.8 | ||
| Liberal Democrats gain from Labour | Swing | ||||
Derwent
| Party | Candidate | Votes | % | ±% | |
|---|---|---|---|---|---|
| Labour | Margaret Redfern | 1,793 | 49.4 | +6.4 | |
| Conservative | Franklyn Harwood | 1,131 | 31.2 | -5.0 | |
| Liberal Democrats | Rafe Nauen | 703 | 19.4 | +7.7 | |
| Majority | 662 | 18.2 | +11.4 | ||
| Turnout | 3,627 | 41.6 | +20.9 | ||
| Labour hold | Swing | ||||
Littleover
| Party | Candidate | Votes | % | ±% | |
|---|---|---|---|---|---|
| Liberal Democrats | Leslie Allen | 2,805 | 59.9 | -4.5 | |
| Conservative | Mark Collins | 1,179 | 25.2 | +2.7 | |
| Labour | Linda McGraw | 696 | 14.9 | +1.8 | |
| Majority | 1,626 | 34.7 | -7.2 | ||
| Turnout | 4,680 | 51.0 | +13.5 | ||
| Liberal Democrats hold | Swing | ||||
Mackworth
| Party | Candidate | Votes | % | ±% | |
|---|---|---|---|---|---|
| Labour | Richard Gerrard | 1,631 | 43.6 | -3.9 | |
| Liberal Democrats | Simon Lysaczenko | 1,220 | 32.6 | +12.0 | |
| Conservative | Michael Hickson | 886 | 23.7 | -8.2 | |
| Majority | 411 | 11.0 | -4.6 | ||
| Turnout | 3,737 | 42.3 | +18.4 | ||
| Labour hold | Swing | ||||
Mickleover
| Party | Candidate | Votes | % | ±% | |
|---|---|---|---|---|---|
| Liberal Democrats | Hilary Jones | 3,578 | 58.9 | ||
| Conservative | Gillian Tatlow | 1,715 | 28.2 | ||
| Labour | David Whitehead | 781 | 12.9 | ||
| Majority | 1,863 | 30.7 | |||
| Turnout | 6,074 | 56.8 | +14.4 | ||
| Liberal Democrats hold | Swing | ||||
Normanton

| Party | Candidate | Votes | % | ±% | |
|---|---|---|---|---|---|
| Labour | Hardyal Dhindsa | 1,583 | 32.9 | -14.7 | |
| Liberal Democrats | Lennin Shillingford | 914 | 19.0 | -19.5 | |
| Respect | Jangir Khan | 701 | 14.6 | +14.6 | |
| UKIP | Ronald Harrison | 636 | 13.2 | +13.2 | |
| Independent | Chander Guru | 547 | 11.4 | +8.3 | |
| Conservative | Mohammed Riasat | 432 | 9.0 | -1.8 | |
| Majority | 669 | 13.9 | +4.8 | ||
| Turnout | 4,813 | 53.0 | +24.1 | ||
| Labour hold | Swing | ||||
Oakwood
| Party | Candidate | Votes | % | ±% | |
|---|---|---|---|---|---|
| Conservative | Richard Smalley | 2,230 | 49.7 | -2.4 | |
| Labour | Phillip Woodhead | 1,468 | 32.7 | -0.6 | |
| Liberal Democrats | Simon King | 785 | 17.5 | +3.0 | |
| Majority | 762 | 17.0 | -1.8 | ||
| Turnout | 4,483 | 47.2 | +20.2 | ||
| Conservative hold | Swing | ||||
Sinfin

| Party | Candidate | Votes | % | ±% | |
|---|---|---|---|---|---|
| Labour | Hardial Dhamrait | 1,460 | 45.1 | -8.6 | |
| Liberal Democrats | Harjonder Naitta | 991 | 30.6 | +11.8 | |
| Conservative | David Hart | 787 | 24.3 | +9.9 | |
| Majority | 469 | 14.5 | -20.4 | ||
| Turnout | 3,238 | 37.4 | +16.8 | ||
| Labour hold | Swing | ||||
Spondon
| Party | Candidate | Votes | % | ±% | |
|---|---|---|---|---|---|
| Conservative | Evonne Berry | 2,533 | 53.0 | -1.0 | |
| Labour | Frank Kirkland | 1,211 | 25.3 | -4.9 | |
| Liberal Democrats | Patrick Peat | 1,036 | 21.7 | +10.0 | |
| Majority | 1,322 | 27.7 | +3.9 | ||
| Turnout | 4,780 | 52.3 | +17.2 | ||
| Conservative hold | Swing | ||||
References
- "Derby council". BBC News Online. Retrieved 30 September 2009.
- "Euro sceptic takes crucial seat". BBC News Online. 11 June 2004. Retrieved 1 October 2009.
- Beattie, Jason; Oakeshott, Isabel (11 June 2004). "Losses in the heartlands and there may be more defeats". Evening Standard. p. 7.
- "Derby Council". BBC News. 11 June 2004.
- "Local elections 2004" (PDF). House of Commons Library. 23 June 2004.
- "Election 2004". Political Science Resources. Archived from the original on 19 March 2012. Retrieved 30 September 2009.