1999 Derby City Council election
The 1999 Derby City Council election took place on 6 May 1999 to elect members of Derby City Council in England. One third of the council was up for election and the Labour party kept overall control of the council.[3] Overall turnout was 29.0%.[4]
| |||||||||||||||||||||||||||||
15 of the 44 seats in the Derby City Council 23 seats needed for a majority | |||||||||||||||||||||||||||||
|---|---|---|---|---|---|---|---|---|---|---|---|---|---|---|---|---|---|---|---|---|---|---|---|---|---|---|---|---|---|
| |||||||||||||||||||||||||||||
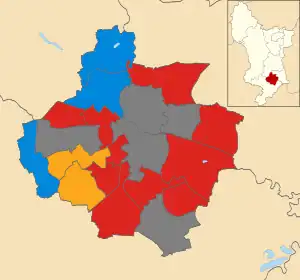 Map showing the results of the 1999 Derby City Council elections. | |||||||||||||||||||||||||||||
| |||||||||||||||||||||||||||||
After the election, the composition of the council was
Election result
| Party | Seats | Gains | Losses | Net gain/loss | Seats % | Votes % | Votes | +/− | |
|---|---|---|---|---|---|---|---|---|---|
| Labour | 10 | 0 | 3 | 66.7 | 47.8 | 18,371 | |||
| Conservative | 3 | 2 | 0 | 20.0 | 30.8 | 11,840 | |||
| Liberal Democrats | 2 | 1 | 0 | 13.3 | 20.2 | 7,753 | |||
Ward results
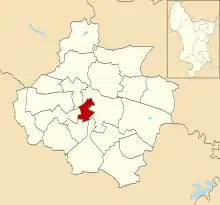
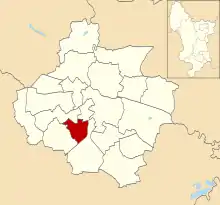
Abbey
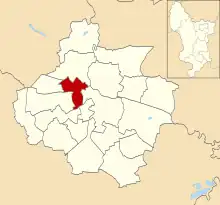
Location of Abbey ward
| Party | Candidate | Votes | % | |
|---|---|---|---|---|
| Labour | M. Walker | 1,156 | 58.8% | |
| Liberal Democrats | P. Clayden | 365 | 18.6% | |
| Conservative | H. Love | 363 | 18.5% | |
| Green | E. Wall | 82 | 4.2% | |
| Turnout | 16.6% | |||
| Labour hold | ||||
Allestree
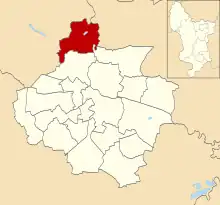
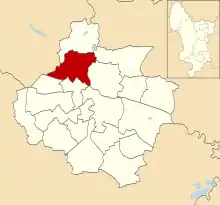
Location of Allestree ward
| Party | Candidate | Votes | % | |
|---|---|---|---|---|
| Conservative | G. Du Sautoy | 1,738 | 61.3% | |
| Labour | M. Daullah | 613 | 21.6% | |
| Liberal Democrats | S. King | 486 | 17.1% | |
| Turnout | 35.3% | |||
| Conservative hold | ||||
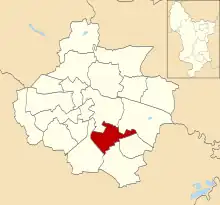
Alvaston
Location of Alvaston ward
| Party | Candidate | Votes | % | |
|---|---|---|---|---|
| Labour | J. Ayliss | 1,128 | 60.8% | |
| Conservative | Willitts P. | 525 | 28.3% | |
| Liberal Democrats | T. Hall | 202 | 10.9% | |
| Turnout | % | |||
| Labour hold | ||||
Babington
Location of Babington ward
| Party | Candidate | Votes | % | |
|---|---|---|---|---|
| Labour | A. Kalia | 940 | 43.7% | |
| Conservative | M. Yaqub | 891 | 41.4% | |
| Liberal Democrats | M. Rashid | 170 | 7.9% | |
| Green | L. Davies | 152 | 7.1% | |
| Turnout | % | |||
| Labour hold | ||||
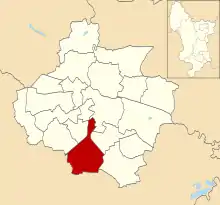
Blagreaves
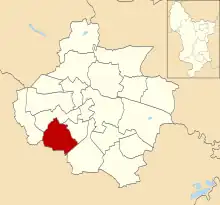
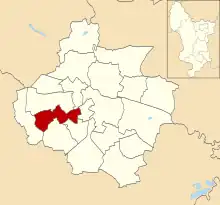
Location of Blagreaves ward
| Party | Candidate | Votes | % | |
|---|---|---|---|---|
| Liberal Democrats | R. Troup | 1,807 | 48.3% | |
| Labour | M. Redfern | 1,466 | 39.2% | |
| Conservative | P. White | 469 | 12.5% | |
| Turnout | 39.4% | |||
| Liberal Democrats gain from Labour | ||||
Boulton
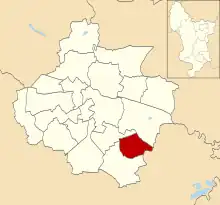
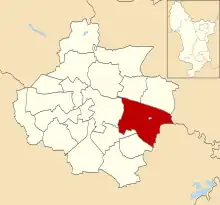
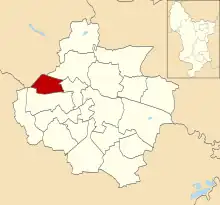
Location of Boulton ward
| Party | Candidate | Votes | % | |
|---|---|---|---|---|
| Labour | R. Blanksby | 1,432 | 60.5% | |
| Conservative | S. Hart | 554 | 23.4% | |
| Independent Labour | S. Conway | 200 | 8.4% | |
| Liberal Democrats | M. Skelton | 181 | 7.6% | |
| Turnout | 28.2% | |||
| Labour hold | ||||
Breadsall
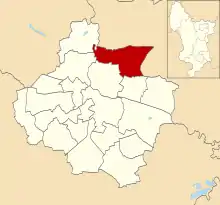
Location of Breadsall ward
| Party | Candidate | Votes | % | |
|---|---|---|---|---|
| Labour | P. Woodhead | 1,866 | 51.6% | |
| Conservative | M. Webb | 1,428 | 39.5% | |
| Liberal Democrats | P. Turner | 321 | 8.9% | |
| Turnout | 22.9% | |||
| Labour hold | ||||
Darley
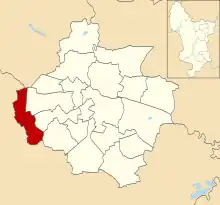
Location of Darley ward
| Party | Candidate | Votes | % | |
|---|---|---|---|---|
| Conservative | P. Hickson | 1,665 | 48.1% | |
| Labour | D. Roberts | 1,402 | 40.5% | |
| Liberal Democrats | J. Keane | 392 | 11.3% | |
| Turnout | 36.6% | |||
| Conservative gain from Labour | ||||
Littleover
Location of Littleover ward
| Party | Candidate | Votes | % | |
|---|---|---|---|---|
| Liberal Democrats | M. Burgess | 1,746 | 58.6% | |
| Labour | L. Shillingford | 753 | 25.3% | |
| Conservative | L. Skelton | 479 | 16.1% | |
| Turnout | 41.3% | |||
| Liberal Democrats hold | ||||
Mackworth
Location of Mackworth ward
| Party | Candidate | Votes | % | |
|---|---|---|---|---|
| Labour | R. Gerrard | 1,276 | 68.7% | |
| Conservative | W. Annable | 408 | 22.0% | |
| Liberal Democrats | W. Savage | 174 | 9.4% | |
| Turnout | 29.6% | |||
| Labour hold | ||||
Mickleover
Location of Mickleover ward
| Party | Candidate | Votes | % | |
|---|---|---|---|---|
| Conservative | M. Lindsay | 1,085 | 34.1% | |
| Labour | A. Macdonald | 1,076 | 33.8% | |
| Liberal Democrats | J. Foxon | 1,025 | 32.2% | |
| Turnout | 34.1% | |||
| Conservative gain from Labour | ||||
Normanton
Location of Normanton ward
| Party | Candidate | Votes | % | |
|---|---|---|---|---|
| Labour | Chris Williamson | 1,292 | 69.2% | |
| Conservative | J. Lee | 297 | 15.9% | |
| Liberal Democrats | B. Lowe | 278 | 14.9% | |
| Turnout | 26.6% | |||
| Labour hold | ||||
Osmanton
Location of Osmaston ward
| Party | Candidate | Votes | % | |
|---|---|---|---|---|
| Labour | J. McGiven | 676 | 69.5% | |
| Conservative | J. Magee | 149 | 15.3% | |
| Liberal Democrats | B. Harry | 104 | 10.7% | |
| Independent | G. Hardy | 44 | 4.5% | |
| Turnout | 17.3% | |||
| Labour hold | ||||
Sinfin
Location of Sinfin ward
| Party | Candidate | Votes | % | |
|---|---|---|---|---|
| Labour | A. Nath | 1,529 | 77.7% | |
| Conservative | D. Hart | 260 | 13.2% | |
| Liberal Democrats | A. Piggott | 180 | 9.1% | |
| Turnout | 24.5% | |||
| Labour hold | ||||
Spondon
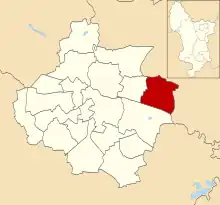
Location of Spondon ward
| Party | Candidate | Votes | % | |
|---|---|---|---|---|
| Labour | J. Ahern | 1,766 | 48.8% | |
| Conservative | M. Sandford | 1,529 | 42.3% | |
| Liberal Democrats | P. Peat | 322 | 8.9% | |
| Turnout | 37.0% | |||
| Labour hold | ||||
References
- "Council compositions by year". The Elections Centre.
- "Local Election Summaries 1999". The Elections Centre.
- "Britain votes: Local Council Election Results". The Independent. 7 May 1999. p. 12.
- "Local Election Results, 1999". Centre for Research into Elections and Social Trends. Archived from the original on 24 July 2011. Retrieved 27 September 2009.
- "Derby". BBC News Online. Retrieved 27 September 2009.
- "Local Councils: Results round-up". The Times. 7 May 1999. p. 4.
- "Derby City Council Election Results 1979-1995" (PDF). Elections Centre.
This article is issued from Wikipedia. The text is licensed under Creative Commons - Attribution - Sharealike. Additional terms may apply for the media files.