1977 Norwegian parliamentary election
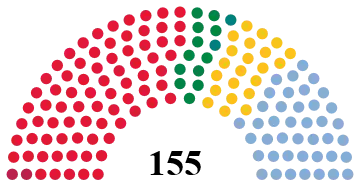
Parliamentary elections were held in Norway on 11 and 12 September 1977.[1] The Labour Party remained the largest party in the Storting, winning 76 of the 155 seats.
| |||||||||||||||||||||||||||||||||||||||||||||||||||||||||||||||||||||
All 155 seats in the Storting 78 seats needed for a majority | |||||||||||||||||||||||||||||||||||||||||||||||||||||||||||||||||||||
|---|---|---|---|---|---|---|---|---|---|---|---|---|---|---|---|---|---|---|---|---|---|---|---|---|---|---|---|---|---|---|---|---|---|---|---|---|---|---|---|---|---|---|---|---|---|---|---|---|---|---|---|---|---|---|---|---|---|---|---|---|---|---|---|---|---|---|---|---|---|
| |||||||||||||||||||||||||||||||||||||||||||||||||||||||||||||||||||||
| |||||||||||||||||||||||||||||||||||||||||||||||||||||||||||||||||||||
Campaign
Political parties
| Name | Ideology | Position | Leader | 1973 result | |||
|---|---|---|---|---|---|---|---|
| Votes (%) | Seats | ||||||
| Ap | Labour Party Arbeiderpartiet |
Social democracy | Centre-left | Reiulf Steen | 35.2% | 62 / 155 | |
| H | Conservative Party Høyre |
Conservatism | Centre-right | Erling Norvik | 17.2% | 29 / 155 | |
| KrF | Christian Democratic Party Kristelig Folkeparti |
Christian democracy | Centre to centre-right | Lars Korvald | 11.8% | 20 / 155 | |
| SV | Socialist Left Party Sosialistisk Venstreparti |
Democratic socialism | Left-wing | Berge Furre | 11.2% | 16 / 155 | |
| Sp | Centre Party Senterpartiet |
Agrarianism | Centre | Gunnar Stålsett | 6.8% | 21 / 155 | |
| FrP | Progress Party Fremskrittspartiet |
Classical liberalismRight-libertarianism | Right-wing | Arve Lønnum | 5.0% | 4 / 155 | |
| DLF | New People's Party Det Liberale Folkepartiet |
Social liberalismPro-Europeanism | Centre | Magne Lerheim | 3.4% | 1 / 155 | |
| V | Liberal Party Venstre |
Social liberalism | Centre | Hans Hammond Rossbach | 2.3% | 2 / 155 | |
Debates
| 1977 Norwegian general election debates | ||||||||||||
|---|---|---|---|---|---|---|---|---|---|---|---|---|
| Date | Time | Organizers | P Present I Invitee N Non-invitee | |||||||||
| Ap | H | KrF | Sv | Sp | Frp | Dlp | V | NKP | Refs | |||
| 8 Sep | 23:00 | NRK | P Reiulf Steen, Odvar Nordli |
P Kåre Willoch |
P Lars Korvald |
P Reidar T. Larsen |
P Gunnar Stålsett |
P Arve Lønnum |
P Magne Lerheim |
P Hans Hammond Rossbach |
P Martin Gunnar Knutsen |
[2] |
| 8 Sep | 23:00 | NRK | P Reiulf Steen, Odvar Nordli |
P Erling Norvik |
P Lars Korvald |
P Berge Furre |
P Gunnar Stålsett |
P Arve Lønnum |
P Magne Lerheim |
P Hans Hammond Rossbach |
P Martin Gunnar Knutsen |
[3] |
Results
 | |||||
|---|---|---|---|---|---|
| Party | Votes | % | Seats | +/– | |
| Labour Party | 972,434 | 42.26 | 76 | +14 | |
| Conservative Party | 563,783 | 24.50 | 40 | +12 | |
| Christian Democratic Party | 224,355 | 9.75 | 18 | +2 | |
| Centre Party | 184,087 | 8.00 | 11 | –9 | |
| Non-socialist joint lists[lower-alpha 2] | 111,412 | 4.84 | 7 | – | |
| Socialist Left Party | 96,248 | 4.18 | 2 | –14 | |
| Liberal Party | 54,243 | 2.36 | 1 | 0 | |
| Progress Party | 43,351 | 1.88 | 0 | –4 | |
| New People's Party | 22,524 | 0.98 | 0 | –1 | |
| Red Electoral Alliance | 14,515 | 0.63 | 0 | 0 | |
| Communist Party | 8,448 | 0.37 | 0 | – | |
| Single Person's Party | 2,740 | 0.12 | 0 | 0 | |
| Democratic Party | 1,322 | 0.06 | 0 | 0 | |
| Freely Elected Representatives | 1,149 | 0.05 | 0 | New | |
| Lapp People's List | 499 | 0.02 | 0 | 0 | |
| Total | 2,301,110 | 100.00 | 155 | 0 | |
| Valid votes | 2,301,110 | 99.85 | |||
| Invalid/blank votes | 3,386 | 0.15 | |||
| Total votes | 2,304,496 | 100.00 | |||
| Registered voters/turnout | 2,780,190 | 82.89 | |||
| Source: Nohlen & Stöver | |||||
Seat distribution
| Constituency | Total seats |
Seats won | |||||
|---|---|---|---|---|---|---|---|
| Ap | H | KrF | Sp | SV | V | ||
| Akershus | 10 | 4 | 4 | 1 | 1 | ||
| Aust-Agder | 4 | 2 | 1 | 1 | |||
| Buskerud | 7 | 4 | 2 | 1 | |||
| Finnmark | 4 | 3 | 1 | ||||
| Hedmark | 8 | 6 | 1 | 1 | |||
| Hordaland | 15 | 6 | 5 | 3 | 1 | ||
| Møre og Romsdal | 10 | 3 | 2 | 3 | 1 | 1 | |
| Nord-Trøndelag | 6 | 3 | 1 | 2 | |||
| Nordland | 12 | 6 | 2 | 2 | 1 | 1 | |
| Oppland | 7 | 4 | 1 | 1 | 1 | ||
| Oslo | 15 | 7 | 6 | 1 | 1 | ||
| Østfold | 8 | 5 | 2 | 1 | |||
| Rogaland | 10 | 4 | 3 | 2 | 1 | ||
| Sogn og Fjordane | 5 | 2 | 1 | 1 | 1 | ||
| Sør-Trøndelag | 10 | 5 | 2 | 1 | 1 | 1 | |
| Telemark | 6 | 4 | 1 | 1 | |||
| Troms | 6 | 3 | 2 | 1 | |||
| Vest-Agder | 5 | 2 | 1 | 1 | 1 | ||
| Vestfold | 7 | 3 | 3 | 1 | |||
| Total | 155 | 76 | 41 | 22 | 12 | 2 | 2 |
| Source: Norges Offisielle Statistikk | |||||||
Notes
- As the Socialist Electoral League
- Seven seats were won by joint lists, of which four went to the Christian Democratic Party, and one each to the Centre Party, the Conservative Party and the Liberal Party.[4]
References
- Dieter Nohlen & Philip Stöver (2010) Elections in Europe: A data handbook, p1438 ISBN 978-3-8329-5609-7
- "Partilederdebatt". 16 July 2016.
- "Etter Stortingsvalget 1977: Partilederdebatt". 16 July 2016.
- Nohlen & Stöver, pp1459-1460
This article is issued from Wikipedia. The text is licensed under Creative Commons - Attribution - Sharealike. Additional terms may apply for the media files.
.jpg.webp)
.jpg.webp)

.jpg.webp)
