1953 Norwegian parliamentary election
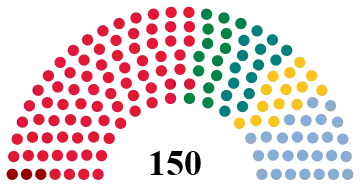
Parliamentary elections were held in Norway on 12 October 1953.[1] The result was a victory for the Labour Party, which won 77 of the 150 seats in the Storting.
| |||||||||||||||||||||||||||||||||||||||||||||||||||||||||||||||||||||
All 150 seats in the Norwegian Parliament 76 seats were needed for a majority | |||||||||||||||||||||||||||||||||||||||||||||||||||||||||||||||||||||
|---|---|---|---|---|---|---|---|---|---|---|---|---|---|---|---|---|---|---|---|---|---|---|---|---|---|---|---|---|---|---|---|---|---|---|---|---|---|---|---|---|---|---|---|---|---|---|---|---|---|---|---|---|---|---|---|---|---|---|---|---|---|---|---|---|---|---|---|---|---|
| |||||||||||||||||||||||||||||||||||||||||||||||||||||||||||||||||||||
| |||||||||||||||||||||||||||||||||||||||||||||||||||||||||||||||||||||
Results
 | |||||
|---|---|---|---|---|---|
| Party | Votes | % | Seats | +/– | |
| Labour Party | 830,448 | 46.66 | 77 | –8 | |
| Conservative Party | 327,971 | 18.43 | 26 | +4 | |
| Christian Democratic Party | 186,627 | 10.49 | 14 | +5 | |
| Liberal Party | 177,662 | 9.98 | 15 | –6 | |
| Farmers' Party | 157,018 | 8.82 | 14 | +2 | |
| Communist Party | 90,422 | 5.08 | 3 | +3 | |
| Farmers–Conservatives[lower-alpha 1] | 9,661 | 0.54 | 1 | – | |
| Wild votes | 22 | 0.00 | – | – | |
| Total | 1,779,831 | 100.00 | 150 | 0 | |
| Valid votes | 1,779,831 | 99.41 | |||
| Invalid/blank votes | 10,500 | 0.59 | |||
| Total votes | 1,790,331 | 100.00 | |||
| Registered voters/turnout | 2,256,799 | 79.33 | |||
| Source: Nohlen & Stöver | |||||
Seat distribution
| Constituency | Total seats |
Seats won | |||||
|---|---|---|---|---|---|---|---|
| Ap | H | V | KrF | B | K | ||
| Akershus | 7 | 4 | 2 | 1 | |||
| Aust-Agder | 4 | 2 | 1 | 1 | |||
| Bergen | 5 | 3 | 1 | 1 | |||
| Buskerud | 7 | 4 | 2 | 1 | |||
| Finnmark | 4 | 2 | 1 | 1 | |||
| Hedmark | 8 | 5 | 1 | 1 | 1 | ||
| Hordaland | 10 | 4 | 1 | 2 | 2 | 1 | |
| Møre og Romsdal | 10 | 4 | 1 | 2 | 2 | 1 | |
| Nord-Trøndelag | 6 | 3 | 1 | 2 | |||
| Nordland | 12 | 7 | 2 | 1 | 1 | 1 | |
| Oppland | 7 | 5 | 2 | ||||
| Oslo | 13 | 5 | 5 | 1 | 1 | 1 | |
| Østfold | 8 | 5 | 1 | 1 | 1 | ||
| Rogaland | 10 | 3 | 2 | 2 | 2 | 1 | |
| Sogn og Fjordane | 5 | 2 | 1 | 1 | 1 | ||
| Sør-Trøndelag | 10 | 5 | 2 | 1 | 1 | 1 | |
| Telemark | 6 | 4 | 1 | 1 | |||
| Troms | 6 | 4 | 1 | 1 | |||
| Vest-Agder | 5 | 2 | 1 | 1 | 1 | ||
| Vestfold | 7 | 4 | 3 | ||||
| Total | 150 | 77 | 27 | 15 | 14 | 14 | 3 |
| Source: Norges Offisielle Statistikk | |||||||
Notes
- The joint list of the Farmers' Party and Conservative Party won one seat, which was taken by the Conservative Party.[2]
References
- Dieter Nohlen & Philip Stöver (2010) Elections in Europe: A data handbook, p1438 ISBN 978-3-8329-5609-7
- Nohlen & Stöver, p1459
This article is issued from Wikipedia. The text is licensed under Creative Commons - Attribution - Sharealike. Additional terms may apply for the media files.


