1956 Austrian legislative election
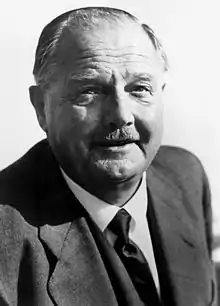
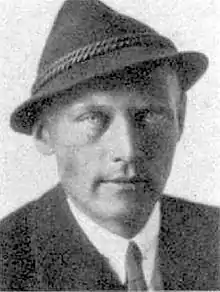
Parliamentary elections were held in Austria on 13 May 1956.[1] The result was a victory for the Austrian People's Party, which won 82 of the 165 seats in the National Council. Voter turnout was 96%.[2] Although the ÖVP had come up one seat short of an absolute majority, ÖVP leader and Chancellor Julius Raab retained the grand coalition with the Socialists, with the SPÖ leader Adolf Schärf as Vice-Chancellor.
| |||||||||||||||||||||||||||||||||||||||||||||||||||||||||||
165 seats in the National Council of Austria 83 seats needed for a majority | |||||||||||||||||||||||||||||||||||||||||||||||||||||||||||
|---|---|---|---|---|---|---|---|---|---|---|---|---|---|---|---|---|---|---|---|---|---|---|---|---|---|---|---|---|---|---|---|---|---|---|---|---|---|---|---|---|---|---|---|---|---|---|---|---|---|---|---|---|---|---|---|---|---|---|---|
| |||||||||||||||||||||||||||||||||||||||||||||||||||||||||||
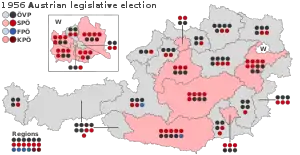 Results of the election, showing seats won by constituency and nationwide. Constituencies are shaded according to the first-place party. | |||||||||||||||||||||||||||||||||||||||||||||||||||||||||||
| |||||||||||||||||||||||||||||||||||||||||||||||||||||||||||
| This article is part of a series on the |
| Politics of Austria |
|---|
 |
Results
| Party | Votes | % | Seats | +/– | |
|---|---|---|---|---|---|
| Austrian People's Party | 1,999,986 | 45.96 | 82 | +8 | |
| Socialist Party of Austria | 1,873,295 | 43.05 | 74 | +1 | |
| Freedom Party of Austria | 283,749 | 6.52 | 6 | –8 | |
| Communists and Left Socialists | 192,438 | 4.42 | 3 | –1 | |
| Free Workers Movement of Austria | 1,812 | 0.04 | 0 | New | |
| Party of Reason | 284 | 0.01 | 0 | New | |
| Ergokratische Party | 231 | 0.01 | 0 | New | |
| Austrian Patriotic Party | 83 | 0.00 | 0 | 0 | |
| Austrian Middle Class Party | 23 | 0.00 | 0 | New | |
| Parliamentary Representatives of the People prevented from voting, Non-Voters and Invalid Voters | 7 | 0.00 | 0 | New | |
| Total | 4,351,908 | 100.00 | 165 | 0 | |
| Valid votes | 4,351,908 | 98.29 | |||
| Invalid/blank votes | 75,803 | 1.71 | |||
| Total votes | 4,427,711 | 100.00 | |||
| Registered voters/turnout | 4,614,464 | 95.95 | |||
| Source: Nohlen & Stöver | |||||
References
- Dieter Nohlen & Philip Stöver (2010) Elections in Europe: A data handbook, p196 ISBN 978-3-8329-5609-7
- Nohlen & Stöver, p214
This article is issued from Wikipedia. The text is licensed under Creative Commons - Attribution - Sharealike. Additional terms may apply for the media files.
