West Lancashire Borough Council elections
West Lancashire Borough Council elections are generally held three years out of every four, with a third of the council elected each time. West Lancashire Borough Council is the local authority for the non-metropolitan district of West Lancashire in Lancashire, England. Since the last boundary changes in 2023 the council has comprised 45 councillors representing 15 wards, with each ward electing three councillors.[1]
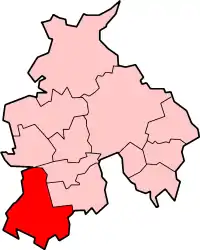
West Lancashire shown within the non-metropolitan county of Lancashire (Unitary authorities excluded)
Council elections
- 1973 West Lancashire District Council election
- 1976 West Lancashire District Council election (New ward boundaries)[2]
- 1979 West Lancashire District Council election
- 1980 West Lancashire District Council election
- 1982 West Lancashire District Council election (District boundary changes took place but the number of seats remained the same)[3]
- 1983 West Lancashire District Council election
- 1984 West Lancashire District Council election
- 1986 West Lancashire District Council election
- 1987 West Lancashire District Council election
- 1988 West Lancashire District Council election
- 1990 West Lancashire District Council election
- 1991 West Lancashire District Council election
- 1992 West Lancashire District Council election
- 1994 West Lancashire District Council election (District boundary changes took place but the number of seats remained the same)[4][5][6][7]
- 1995 West Lancashire District Council election
- 1996 West Lancashire District Council election
- 1998 West Lancashire District Council election
- 1999 West Lancashire District Council election
- 2000 West Lancashire District Council election
- 2002 West Lancashire District Council election (New ward boundaries reduced the number of seats by 1)[8][9]
- 2003 West Lancashire District Council election
- 2004 West Lancashire District Council election
- 2006 West Lancashire District Council election
- 2007 West Lancashire District Council election (Some new ward boundaries)[10]
- 2008 West Lancashire District Council election
- 2010 West Lancashire Borough Council election
- 2011 West Lancashire Borough Council election
- 2012 West Lancashire Borough Council election
- 2014 West Lancashire Borough Council election
- 2015 West Lancashire Borough Council election
- 2016 West Lancashire Borough Council election
- 2018 West Lancashire Borough Council election
- 2019 West Lancashire Borough Council election
- 2021 West Lancashire Borough Council election
- 2022 West Lancashire Borough Council election
- 2023 West Lancashire Borough Council election (Reduced to 45 council seats)
Borough result maps
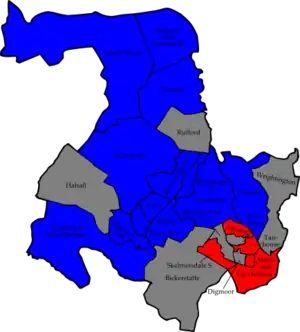 2006 results map
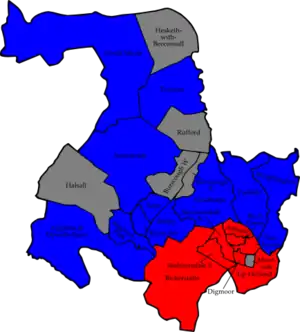 2007 results map
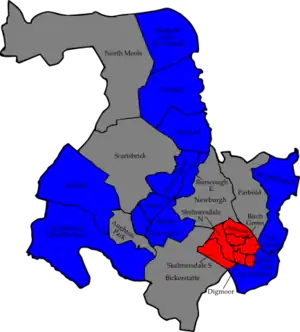 2008 results map
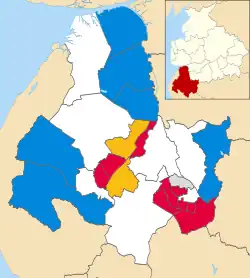 2021 results map
By-election results
1994-1998
| Party | Candidate | Votes | % | ±% | |
|---|---|---|---|---|---|
| Labour | 1,537 | 87.7 | |||
| Conservative | 215 | 12.3 | |||
| Majority | 1,322 | 75.4 | |||
| Turnout | 1,752 | 23.0 | |||
| Labour hold | Swing | ||||
| Party | Candidate | Votes | % | ±% | |
|---|---|---|---|---|---|
| Labour | 745 | 67.0 | |||
| Conservative | 367 | 3.0 | |||
| Majority | 378 | 34.0 | |||
| Turnout | 1,112 | 44.3 | |||
| Labour hold | Swing | ||||
| Party | Candidate | Votes | % | ±% | |
|---|---|---|---|---|---|
| Labour | 435 | 90.6 | +2.7 | ||
| Conservative | 45 | 9.4 | +0.4 | ||
| Majority | 390 | 81.2 | |||
| Turnout | 480 | 13.6 | |||
| Labour hold | Swing | ||||
1998-2002
| Party | Candidate | Votes | % | ±% | |
|---|---|---|---|---|---|
| Labour | 585 | 50.0 | -7.4 | ||
| Conservative | 533 | 45.6 | +5.0 | ||
| Liberal Democrats | 45 | 3.8 | +3.8 | ||
| Natural Law | 7 | 0.6 | -1.4 | ||
| Majority | 52 | 4.4 | |||
| Turnout | 1,170 | ||||
| Labour hold | Swing | ||||
| Party | Candidate | Votes | % | ±% | |
|---|---|---|---|---|---|
| Conservative | 1,385 | 50.4 | -8.7 | ||
| Labour | 1,363 | 49.6 | +12.1 | ||
| Majority | 22 | 0.8 | |||
| Turnout | 2,748 | ||||
| Conservative gain from Independent | Swing | ||||
| Party | Candidate | Votes | % | ±% | |
|---|---|---|---|---|---|
| Labour | 929 | 58.5 | +1.1 | ||
| Conservative | 660 | 41.5 | +3.1 | ||
| Majority | 269 | 17.0 | |||
| Turnout | 1,589 | ||||
| Labour hold | Swing | ||||
| Party | Candidate | Votes | % | ±% | |
|---|---|---|---|---|---|
| Conservative | 571 | 63.4 | +10.0 | ||
| Labour | 330 | 36.6 | -6.0 | ||
| Majority | 241 | 26.8 | |||
| Turnout | 901 | 14.0 | |||
| Conservative hold | Swing | ||||
| Party | Candidate | Votes | % | ±% | |
|---|---|---|---|---|---|
| Labour | 220 | 81.8 | +9.5 | ||
| Conservative | 49 | 18.2 | -9.5 | ||
| Majority | 179 | 63.8 | |||
| Turnout | 269 | 8.3 | |||
| Labour hold | Swing | ||||
2002-2006
| Party | Candidate | Votes | % | ±% | |
|---|---|---|---|---|---|
| Labour | 608 | 59.8 | +11.8 | ||
| Conservative | 408 | 40.2 | +4.7 | ||
| Majority | 200 | 19.6 | |||
| Turnout | 1,016 | 20.5 | |||
| Labour hold | Swing | ||||
2006-2010
| Party | Candidate | Votes | % | ±% | |
|---|---|---|---|---|---|
| Labour | Jackie Coyle | 515 | 59.8 | -16.7 | |
| UKIP | Helen Daniels | 236 | 27.4 | +27.4 | |
| Conservative | Sarah Ainscough | 110 | 12.8 | -10.7 | |
| Majority | 279 | 32.4 | |||
| Turnout | 861 | 27.9 | |||
| Labour hold | Swing | ||||
2010-2014
| Party | Candidate | Votes | % | ±% | |
|---|---|---|---|---|---|
| Labour | Nicola Pryce Roberts | 644 | 73.9 | +0.6 | |
| Conservative | Sarah Ainscough | 122 | 14.0 | -4.2 | |
| UKIP | Michael Brennan | 105 | 12.1 | +12.1 | |
| Majority | 522 | 59.9 | |||
| Turnout | 871 | 17.6 | |||
| Labour hold | Swing | ||||
| Party | Candidate | Votes | % | ±% | |
|---|---|---|---|---|---|
| Labour | John Fillis | 749 | 51.2 | -6.9 | |
| Conservative | David Sudworth | 597 | 40.8 | -1.2 | |
| UKIP | Gary McNulty | 118 | 8.1 | +8.1 | |
| Majority | 152 | 10.4 | |||
| Turnout | 1,464 | 29.5 | |||
| Labour hold | Swing | ||||
| Party | Candidate | Votes | % | ±% | |
|---|---|---|---|---|---|
| Labour | Chris Wynn | 685 | 86.8 | -3.8 | |
| Green | Peter Cranie | 57 | 7.2 | +7.2 | |
| Conservative | Edward McCarthy | 47 | 6.0 | -1.3 | |
| Majority | 628 | 79.6 | |||
| Turnout | 789 | ||||
| Labour hold | Swing | ||||
| Party | Candidate | Votes | % | ±% | |
|---|---|---|---|---|---|
| Conservative | David Whittington | 554 | 49.6 | -18.3 | |
| Labour | Clare Gillard | 461 | 41.2 | +9.1 | |
| UKIP | Damon Noone | 103 | 9.2 | +9.2 | |
| Majority | 93 | 8.3 | |||
| Turnout | 1,118 | ||||
| Conservative hold | Swing | ||||
2014-2018
| Party | Candidate | Votes | % | ±% | |
|---|---|---|---|---|---|
| Labour | Jennifer Patterson | 591 | 87.9 | -1.8 | |
| Conservative | David Meadows | 81 | 12.1 | +1.8 | |
| Majority | 510 | 75.9 | |||
| Turnout | 672 | ||||
| Labour hold | Swing | ||||
| Party | Candidate | Votes | % | ±% | |
|---|---|---|---|---|---|
| Conservative | Doreen Stephenson | 1,381 | 55.8 | +7.4 | |
| Labour | Bernie Green | 1,095 | 44.2 | +8.7 | |
| Majority | 286 | 11.6 | |||
| Turnout | 2,476 | ||||
| Conservative hold | Swing | ||||
| Party | Candidate | Votes | % | ±% | |
|---|---|---|---|---|---|
| OWL | Ian Davis | 705 | 42.4 | +0.6 | |
| Labour | George Oliver | 596 | 35.8 | -1.0 | |
| Conservative | Jane Houlgrave | 362 | 21.8 | +4.2 | |
| Majority | 109 | 6.6 | |||
| Turnout | 1,667 | ||||
| OWL gain from Conservative | Swing | ||||
2018-2022
| Party | Candidate | Votes | % | ±% | |
|---|---|---|---|---|---|
| Conservative | Joan Witter | 510 | 41.2 | -18.6 | |
| Labour | Nick Kemp | 432 | 34.9 | +4.0 | |
| Independent | Steve Kirby | 295 | 23.8 | +23.8 | |
| Majority | 78 | 6.3 | |||
| Turnout | 1,237 | ||||
| Conservative hold | Swing | ||||
| Party | Candidate | Votes | % | ±% | |
|---|---|---|---|---|---|
| Labour | Gareth Dowling | 641 | 40.8 | -10.1 | |
| OWL | Kate Mitchell | 567 | 36.1 | +20.7 | |
| Conservative | Jeffrey Vernon | 364 | 23.2 | -10.6 | |
| Majority | 74 | 4.7 | |||
| Turnout | 1,572 | ||||
| Labour hold | Swing | ||||
| Party | Candidate | Votes | % | ±% | |
|---|---|---|---|---|---|
| Labour | Ron Cooper | 464 | 72.3 | -12.8 | |
| Independent | Aaron Body | 129 | 20.1 | +20.1 | |
| Conservative | Alexander Blundell | 49 | 7.6 | -7.3 | |
| Majority | 335 | 52.2 | |||
| Turnout | 642 | ||||
| Labour hold | Swing | ||||
| Party | Candidate | Votes | % | ±% | |
|---|---|---|---|---|---|
| Labour | Sue Gregson | 390 | 60.8 | +2.2 | |
| Skelmersdale Independent Party | Andrew Taylor | 191 | 29.8 | -5.3 | |
| Conservative | George Rear | 60 | 9.4 | +3.1 | |
| Majority | 199 | 31.0 | |||
| Turnout | 641 | ||||
| Labour hold | Swing | ||||
| Party | Candidate | Votes | % | ±% | |
|---|---|---|---|---|---|
| Conservative | John Howard | 634 | 64.9 | ||
| Labour | Liz Savage | 343 | 35.1 | ||
| Majority | 291 | 29.8 | |||
| Turnout | 977 | ||||
| Conservative hold | Swing | ||||
References
- "The West Lancashire (Electoral Changes) Order 2022", legislation.gov.uk, The National Archives, SI 2022/1179, retrieved 27 June 2023
- The District of West Lancashire (Electoral Arrangements) Order 1976
- legislation.gov.uk - The Greater Manchester and Lancashire (Areas) Order 1981. Retrieved on 18 November 2015.
- legislation.gov.uk - The Cheshire, Greater Manchester, Lancashire and Merseyside (County and District Boundaries) Order 1993. Retrieved on 5 November 2015.
- legislation.gov.uk - The Cheshire, Lancashire and Merseyside (County and Metropolitan Borough Boundaries) Order 1993. Retrieved on 5 November 2015.
- legislation.gov.uk - The Cheshire, Lancashire and Merseyside (County Boundaries) Order 1993. Retrieved on 5 November 2015.
- legislation.gov.uk - The Lancashire and Merseyside (County Boundaries) Order 1993. Retrieved on 5 November 2015.
- "West Lancashire". BBC News Online. Retrieved 13 April 2010.
- "The District of West Lancashire (Electoral Changes) Order 2001", legislation.gov.uk, The National Archives, SI 2001/2432, retrieved 26 August 2022
- legislation.gov.uk - The West Lancashire (Parish Electoral Arrangements and Electoral Changes) Order 2007. Retrieved on 3 November 2015.
- "Tories boosted in local byelections". guardian.co.uk. London. 14 October 2005. Retrieved 13 April 2010.
- "Skelmersdale councillor Bob Pendleton is defeated as Labour suffer in Lancashire polls". Ormskirk & Skelmersdale Advertiser. 5 June 2009. Retrieved 13 April 2010.
- "Elected Members - Borough By-Election Sept 2010". West Lancashire Borough Council. Retrieved 3 September 2010.
- "Local Elections Archive Project — Digmoor Ward". www.andrewteale.me.uk. Retrieved 18 September 2022.
- "Local Elections Archive Project — Parbold Ward". www.andrewteale.me.uk. Retrieved 18 September 2022.
- "Local Elections Archive Project — Skelmersdale North Ward". www.andrewteale.me.uk. Retrieved 18 September 2022.
- "Local Elections Archive Project — Aughton Park Ward". www.andrewteale.me.uk. Retrieved 18 September 2022.
- "Local Elections Archive Project — Derby Ward". www.andrewteale.me.uk. Retrieved 18 September 2022.
- "Local Elections Archive Project — Hesketh-with-Becconsall Ward". www.andrewteale.me.uk. Retrieved 18 September 2022.
- "Local Elections Archive Project — Knowsley Ward". www.andrewteale.me.uk. Retrieved 18 September 2022.
- "Local Elections Archive Project — Tanhouse Ward". www.andrewteale.me.uk. Retrieved 18 September 2022.
- "Local Elections Archive Project — Birch Green Ward". www.andrewteale.me.uk. Retrieved 18 September 2022.
- "Local Elections Archive Project — North Meols Ward". www.andrewteale.me.uk. Retrieved 18 September 2022.
External links
This article is issued from Wikipedia. The text is licensed under Creative Commons - Attribution - Sharealike. Additional terms may apply for the media files.