2000 United States presidential election in Montana
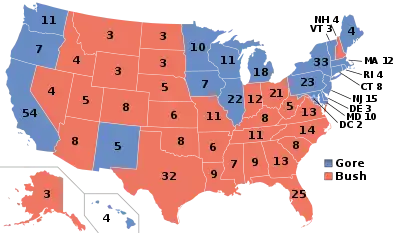
The 2000 United States presidential election in Montana took place on November 7, 2000, and was part of the 2000 United States presidential election. Voters chose three electors to the Electoral College, which voted for president and vice president.
| |||||||||||||||||||||||||||||||||
| |||||||||||||||||||||||||||||||||
 County Results
| |||||||||||||||||||||||||||||||||
| |||||||||||||||||||||||||||||||||
| Elections in Montana |
|---|
 |
Montana was won by Governor George W. Bush. Bush won most of the counties in the state, and only obtained less than 40% in three counties. Bush won the highest populated county, Yellowstone County with exactly 59% of the vote. Gore won a total of five counties, and did the best in Deer Lodge County.
Ralph Nader, the Green party nominee, performed very well here, getting 5.95% of the vote statewide. He did very well in the western part of the state, getting over 5% of the vote in most of the counties in the region. His best performance by far was in Missoula County, where he got over 15% of the vote, which was the only county Nader cracked double digits. Nader's performance in Montana made it his fifth strongest state after Alaska, Vermont, Massachusetts and Rhode Island.[1]
As of the 2020 presidential election, this is the last election in which Missoula County voted for the Republican candidate. Al Gore's 33.4% of the vote was the worst performance for a Democrat in Montana since Jimmy Carter in 1980, and no Democrat has fallen under that number since. Gore's margin of loss is the largest for a Democrat in Montana since James M. Cox in 1920.
Results
| 2000 United States presidential election in Montana[2] | |||||
|---|---|---|---|---|---|
| Party | Candidate | Votes | Percentage | Electoral votes | |
| Republican | George W. Bush | 240,178 | 58.44% | 3 | |
| Democratic | Al Gore | 137,126 | 33.37% | 0 | |
| Green | Ralph Nader | 24,437 | 5.95% | 0 | |
| Reform | Patrick Buchanan | 5,697 | 1.39% | 0 | |
| Libertarian | Harry Browne | 1,718 | 0.42% | 0 | |
| Constitution | Howard Phillips | 1,155 | 0.28% | 0 | |
| Natural Law | John Hagelin | 675 | 0.16% | 0 | |
| Totals | 410,986 | 100.00% | 3 | ||
| Voter turnout (Voting age/registered) | 61%/59% | ||||
By county
| County | George W. Bush Republican |
Al Gore Democratic |
Various candidates Other parties |
Margin | Total | ||||
|---|---|---|---|---|---|---|---|---|---|
| # | % | # | % | # | % | # | % | ||
| Beaverhead | 3,113 | 74.19% | 799 | 19.04% | 284 | 6.77% | 2,314 | 55.15% | 4,196 |
| Big Horn | 1,651 | 39.68% | 2,345 | 56.36% | 165 | 3.97% | -694 | -16.68% | 4,161 |
| Blaine | 1,410 | 51.11% | 1,246 | 45.16% | 103 | 3.73% | 164 | 5.95% | 2,759 |
| Broadwater | 1,488 | 71.75% | 462 | 22.28% | 124 | 5.98% | 1,026 | 49.47% | 2,074 |
| Carbon | 3,008 | 62.81% | 1,434 | 29.94% | 347 | 7.25% | 1,574 | 32.87% | 4,789 |
| Carter | 573 | 88.84% | 53 | 8.22% | 19 | 2.95% | 520 | 80.62% | 645 |
| Cascade | 18,164 | 54.52% | 13,137 | 39.43% | 2,016 | 6.05% | 5,027 | 15.09% | 33,317 |
| Chouteau | 2,039 | 70.68% | 686 | 23.78% | 160 | 5.55% | 1,353 | 46.90% | 2,885 |
| Custer | 3,156 | 64.34% | 1,501 | 30.60% | 248 | 5.06% | 1,655 | 33.74% | 4,905 |
| Daniels | 750 | 67.57% | 303 | 27.30% | 57 | 5.14% | 447 | 40.27% | 1,110 |
| Dawson | 2,723 | 63.76% | 1,364 | 31.94% | 184 | 4.31% | 1,359 | 31.82% | 4,271 |
| Deer Lodge | 1,493 | 32.93% | 2,672 | 58.93% | 369 | 8.14% | -1,179 | -26.00% | 4,534 |
| Fallon | 1,061 | 77.50% | 256 | 18.70% | 52 | 3.80% | 805 | 58.80% | 1,369 |
| Fergus | 4,353 | 72.62% | 1,352 | 22.56% | 289 | 4.82% | 3,001 | 50.06% | 5,994 |
| Flathead | 22,519 | 66.55% | 8,329 | 24.61% | 2,991 | 8.84% | 14,190 | 41.94% | 33,839 |
| Gallatin | 18,833 | 58.78% | 10,009 | 31.24% | 3,198 | 9.98% | 8,824 | 27.54% | 32,040 |
| Garfield | 651 | 87.50% | 61 | 8.20% | 32 | 4.30% | 590 | 79.30% | 744 |
| Glacier | 1,709 | 41.44% | 2,211 | 53.61% | 204 | 4.95% | -502 | -12.17% | 4,124 |
| Golden Valley | 405 | 76.27% | 88 | 16.57% | 38 | 7.16% | 317 | 59.70% | 531 |
| Granite | 1,181 | 74.28% | 295 | 18.55% | 114 | 7.17% | 886 | 55.73% | 1,590 |
| Hill | 3,392 | 51.72% | 2,760 | 42.09% | 406 | 6.19% | 632 | 9.63% | 6,558 |
| Jefferson | 3,308 | 64.07% | 1,513 | 29.30% | 342 | 6.62% | 1,795 | 34.77% | 5,163 |
| Judith Basin | 1,057 | 75.82% | 278 | 19.94% | 59 | 4.23% | 779 | 55.88% | 1,394 |
| Lake | 6,441 | 56.26% | 3,884 | 33.93% | 1,123 | 9.81% | 2,557 | 22.33% | 11,448 |
| Lewis and Clark | 15,091 | 55.34% | 9,982 | 36.61% | 2,196 | 8.05% | 5,109 | 18.73% | 27,269 |
| Liberty | 752 | 72.03% | 243 | 23.28% | 49 | 4.69% | 509 | 48.75% | 1,044 |
| Lincoln | 5,578 | 71.09% | 1,629 | 20.76% | 639 | 8.14% | 3,949 | 50.33% | 7,846 |
| Madison | 2,656 | 72.65% | 758 | 20.73% | 242 | 6.62% | 1,898 | 51.92% | 3,656 |
| McCone | 827 | 72.42% | 267 | 23.38% | 48 | 4.20% | 560 | 49.04% | 1,142 |
| Meagher | 698 | 74.65% | 176 | 18.82% | 61 | 6.52% | 522 | 55.83% | 935 |
| Mineral | 1,078 | 65.77% | 382 | 23.31% | 179 | 10.92% | 696 | 42.46% | 1,639 |
| Missoula | 21,474 | 46.11% | 17,241 | 37.02% | 7,861 | 16.88% | 4,233 | 9.09% | 46,576 |
| Musselshell | 1,582 | 71.68% | 512 | 23.20% | 113 | 5.12% | 1,070 | 48.48% | 2,207 |
| Park | 4,523 | 61.07% | 2,154 | 29.08% | 729 | 9.84% | 2,369 | 31.99% | 7,406 |
| Petroleum | 254 | 83.01% | 36 | 11.76% | 16 | 5.23% | 218 | 71.25% | 306 |
| Phillips | 1,727 | 77.51% | 423 | 18.99% | 78 | 3.50% | 1,304 | 58.52% | 2,228 |
| Pondera | 1,948 | 67.27% | 792 | 27.35% | 156 | 5.39% | 1,156 | 39.92% | 2,896 |
| Powder River | 860 | 85.32% | 115 | 11.41% | 33 | 3.27% | 745 | 73.91% | 1,008 |
| Powell | 1,971 | 69.60% | 638 | 22.53% | 223 | 7.87% | 1,333 | 47.07% | 2,832 |
| Prairie | 541 | 72.52% | 164 | 21.98% | 41 | 5.50% | 377 | 50.54% | 746 |
| Ravalli | 11,241 | 65.21% | 4,451 | 25.82% | 1,546 | 8.97% | 6,790 | 39.39% | 17,238 |
| Richland | 2,858 | 70.87% | 1,018 | 25.24% | 157 | 3.89% | 1,840 | 45.63% | 4,033 |
| Roosevelt | 1,605 | 42.09% | 2,059 | 54.00% | 149 | 3.91% | -454 | -11.91% | 3,813 |
| Rosebud | 1,826 | 53.35% | 1,394 | 40.72% | 203 | 5.93% | 432 | 12.63% | 3,423 |
| Sanders | 3,144 | 66.60% | 1,165 | 24.68% | 412 | 8.73% | 1,979 | 41.92% | 4,721 |
| Sheridan | 1,176 | 59.85% | 702 | 35.73% | 87 | 4.43% | 474 | 24.12% | 1,965 |
| Silver Bow | 6,299 | 37.71% | 8,967 | 53.68% | 1,437 | 8.60% | -2,628 | -15.97% | 16,703 |
| Stillwater | 2,765 | 70.57% | 925 | 23.61% | 228 | 5.82% | 1,840 | 46.96% | 3,918 |
| Sweet Grass | 1,450 | 78.55% | 305 | 16.52% | 91 | 4.93% | 1,145 | 62.03% | 1,846 |
| Teton | 2,294 | 69.22% | 847 | 25.56% | 173 | 5.22% | 1,447 | 43.66% | 3,314 |
| Toole | 1,639 | 68.92% | 630 | 26.49% | 109 | 4.58% | 1,009 | 42.43% | 2,378 |
| Treasure | 344 | 71.82% | 106 | 22.13% | 29 | 6.05% | 238 | 49.69% | 479 |
| Valley | 2,500 | 63.08% | 1,273 | 32.12% | 190 | 4.79% | 1,227 | 30.96% | 3,963 |
| Wheatland | 708 | 70.87% | 243 | 24.32% | 48 | 4.80% | 465 | 46.55% | 999 |
| Wibaux | 369 | 71.24% | 121 | 23.36% | 28 | 5.41% | 248 | 47.88% | 518 |
| Yellowstone | 33,922 | 59.00% | 20,370 | 35.43% | 3,207 | 5.58% | 13,552 | 23.57% | 57,499 |
| Totals | 240,178 | 58.44% | 137,126 | 33.36% | 33,693 | 8.20% | 103,052 | 25.08% | 410,997 |
Counties that flipped from Democratic to Republican
By congressional district
Due to the state's low population, only one congressional district is allocated. This district, called the At-Large district, because it covers the entire state, and thus is equivalent to the statewide election results.
| District | Bush | Gore | Representative |
|---|---|---|---|
| At-large | 58.4% | 33.4% | Denny Rehberg |
Electors
The electors of each state and the District of Columbia met on December 18, 2000[3] to cast their votes for president and vice president. The following were the members of the Electoral College from the state, each of whom was pledged to and voted for George W. Bush: Thelma Baker, Jack Galt, and Tillie Pierce.[4]
References
- "2000 Presidential Election Statistics". Dave Leip’s Atlas of U.S. Presidential Elections. Retrieved March 5, 2018.
- "2000 Presidential General Election Results - Montana".
- "2000 Post-Election Timeline of Events".
- "President Elect - 2000". Archived from the original on February 12, 2012. Retrieved October 31, 2009.


.jpg.webp)
