Tinglayan
Tinglayan, officially the Municipality of Tinglayan is a 4th class municipality in the province of Kalinga, Philippines. According to the 2020 census, it has a population of 13,148 people.[3]
Tinglayan | |
|---|---|
| Municipality of Tinglayan | |
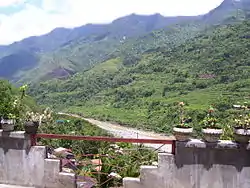
 Chico River Valley | |
 Flag | |
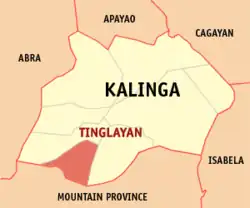
 Map of Kalinga with Tinglayan highlighted | |
OpenStreetMap | |
.svg.png.webp) Tinglayan Location within the Philippines | |
| Coordinates: 17°15′54″N 121°08′56″E | |
| Country | Philippines |
| Region | Cordillera Administrative Region |
| Province | Kalinga |
| District | Lone district |
| Barangays | 20 (see Barangays) |
| Government | |
| • Type | Sangguniang Bayan |
| • Mayor | Sacrament S. Gumilab |
| • Vice Mayor | Rogelio M. Tambalong |
| • Representative | Allen Jesse C. Mangaoang |
| • Municipal Council | Members |
| • Electorate | 11,411 voters (2022) |
| Area | |
| • Total | 283.00 km2 (109.27 sq mi) |
| Elevation | 1,074 m (3,524 ft) |
| Highest elevation | 2,200 m (7,200 ft) |
| Lowest elevation | 443 m (1,453 ft) |
| Population (2020 census)[3] | |
| • Total | 13,148 |
| • Density | 46/km2 (120/sq mi) |
| • Households | 2,453 |
| Economy | |
| • Income class | 4th municipal income class |
| • Poverty incidence | 27.71 |
| • Revenue | ₱ 114.6 million (2020) |
| • Assets | ₱ 179.3 million (2020) |
| • Expenditure | ₱ 108 million (2020) |
| Time zone | UTC+8 (PST) |
| ZIP code | 3804 |
| PSGC | |
| IDD : area code | +63 (0)74 |
| Native languages | Kalinga Ilocano Tagalog |
| Website | https://tinglayan.gov.ph |
Tinglayan is 63 kilometres (39 mi) from Tabuk City and 437 kilometres (272 mi) from Manila.
Geography
Barangays
Tinglayan is politically subdivided into 20 barangays. [5] Each barangay consists of puroks and some have sitios.
- Ambato-Legleg
- Bangad Centro
- Basao
- Belong Manubal
- Butbut-Proper
- Bugnay
- Buscalan
- Dananao
- Loccong
- Lower Bangad
- Luplupa
- Mallango
- Ngibat
- Old Tinglayan
- Poblacion
- Sumadel 1
- Sumadel 2
- Tulgao East
- Tulgao West
- Upper Bangad
Climate
| Climate data for Tinglayan, Kalinga | |||||||||||||
|---|---|---|---|---|---|---|---|---|---|---|---|---|---|
| Month | Jan | Feb | Mar | Apr | May | Jun | Jul | Aug | Sep | Oct | Nov | Dec | Year |
| Average high °C (°F) | 25 (77) |
26 (79) |
28 (82) |
30 (86) |
29 (84) |
29 (84) |
28 (82) |
28 (82) |
28 (82) |
27 (81) |
26 (79) |
25 (77) |
27 (81) |
| Average low °C (°F) | 17 (63) |
18 (64) |
19 (66) |
21 (70) |
22 (72) |
23 (73) |
22 (72) |
22 (72) |
22 (72) |
20 (68) |
20 (68) |
19 (66) |
20 (69) |
| Average precipitation mm (inches) | 23 (0.9) |
28 (1.1) |
33 (1.3) |
64 (2.5) |
232 (9.1) |
242 (9.5) |
258 (10.2) |
266 (10.5) |
245 (9.6) |
201 (7.9) |
87 (3.4) |
69 (2.7) |
1,748 (68.7) |
| Average rainy days | 8.3 | 8.0 | 10.8 | 15.2 | 23.7 | 26.1 | 27.0 | 25.8 | 23.5 | 17.3 | 13.7 | 12.1 | 211.5 |
| Source: Meteoblue[6] | |||||||||||||
Demographics
| Year | Pop. | ±% p.a. |
|---|---|---|
| 1918 | 2,879 | — |
| 1939 | 6,868 | +4.23% |
| 1948 | 6,935 | +0.11% |
| 1960 | 9,135 | +2.32% |
| 1970 | 10,317 | +1.22% |
| 1975 | 10,838 | +0.99% |
| 1980 | 11,703 | +1.55% |
| 1990 | 12,637 | +0.77% |
| 1995 | 13,591 | +1.37% |
| 2000 | 14,164 | +0.89% |
| 2007 | 11,619 | −2.69% |
| 2010 | 12,557 | +2.87% |
| 2015 | 12,868 | +0.47% |
| 2020 | 13,148 | +0.42% |
| Source: Philippine Statistics Authority[7][8][9][10] | ||
In the 2020 census, the population of Tinglayan was 13,148 people,[3] with a density of 46 inhabitants per square kilometre or 120 inhabitants per square mile.
Economy
Government
Local government
Tinglayan, belonging to the lone congressional district of the province of Kalinga, is governed by a mayor designated as its local chief executive and by a municipal council as its legislative body in accordance with the Local Government Code. The mayor, vice mayor, and the councilors are elected directly by the people through an election which is being held every three years.
Elected officials
| Position | Name |
|---|---|
| Congressman | Allen Jesse C. Mangaoang |
| Mayor | Sacrament S. Gumilab |
| Vice-Mayor | Charles A. Abay |
| Councilors | Jerry M. So-ang |
| Johnny D. Lungao | |
| Bartholome M. Aboli | |
| Dominic T. Lad-ing | |
| Roger T. Baculi | |
| Antonio S. Ao-as | |
| Brendon D. Gonnay | |
| Camilo P. Sa-ing | |
Tourism
Tinglayan is famous for its local celebrity, Whang-od, who is the last mambabatok (traditional tattooist). Tourists often visit Tinglayan to see her and have their bodies tattooed.[19]
References
- Municipality of Tinglayan | (DILG)
- "2015 Census of Population, Report No. 3 – Population, Land Area, and Population Density" (PDF). Philippine Statistics Authority. Quezon City, Philippines. August 2016. ISSN 0117-1453. Archived (PDF) from the original on May 25, 2021. Retrieved July 16, 2021.
- Census of Population (2020). "Cordillera Administrative Region (CAR)". Total Population by Province, City, Municipality and Barangay. Philippine Statistics Authority. Retrieved 8 July 2021.
- "PSA Releases the 2018 Municipal and City Level Poverty Estimates". Philippine Statistics Authority. 15 December 2021. Retrieved 22 January 2022.
- "Province: Kalinga". PSGC Interactive. Quezon City, Philippines: Philippine Statistics Authority. Retrieved 12 November 2016.
- "Tinglayan: Average Temperatures and Rainfall". Meteoblue. Retrieved 8 March 2020.
- Census of Population (2015). "Cordillera Administrative Region (CAR)". Total Population by Province, City, Municipality and Barangay. Philippine Statistics Authority. Retrieved 20 June 2016.
- Census of Population and Housing (2010). "Cordillera Administrative Region (CAR)" (PDF). Total Population by Province, City, Municipality and Barangay. National Statistics Office. Retrieved 29 June 2016.
- Censuses of Population (1903–2007). "Cordillera Administrative Region (CAR)". Table 1. Population Enumerated in Various Censuses by Province/Highly Urbanized City: 1903 to 2007. National Statistics Office.
- "Province of Kalinga". Municipality Population Data. Local Water Utilities Administration Research Division. Retrieved 17 December 2016.
- "Poverty incidence (PI):". Philippine Statistics Authority. Retrieved December 28, 2020.
- "Estimation of Local Poverty in the Philippines" (PDF). Philippine Statistics Authority. 29 November 2005.
- "2003 City and Municipal Level Poverty Estimates" (PDF). Philippine Statistics Authority. 23 March 2009.
- "City and Municipal Level Poverty Estimates; 2006 and 2009" (PDF). Philippine Statistics Authority. 3 August 2012.
- "2012 Municipal and City Level Poverty Estimates" (PDF). Philippine Statistics Authority. 31 May 2016.
- "Municipal and City Level Small Area Poverty Estimates; 2009, 2012 and 2015". Philippine Statistics Authority. 10 July 2019.
- "PSA Releases the 2018 Municipal and City Level Poverty Estimates". Philippine Statistics Authority. 15 December 2021. Retrieved 22 January 2022.
- "2019 National and Local Elections" (PDF). Commission on Elections. Retrieved March 13, 2022.
- "The lost tribe and the 'tattoo master'". news.com.au. Australia. 27 May 2015. Retrieved 19 October 2015.
External links
- Philippine Standard Geographic Code
- Philippine Census Information
- Local Governance Performance Management System
