Stoke-on-Trent South (UK Parliament constituency)
Stoke-on-Trent South is a constituency[n 1] created in 1950, and represented in the House of Commons of the UK Parliament since 2017 by Jack Brereton, a Conservative.[n 2] The local electorate returned a Labour MP in every election until 2017, when Brereton became its first Conservative MP.[2] The seat is non-rural and in the upper valley of the Trent covering half of the main city of the Potteries, a major ceramics centre since the 17th century.
| Stoke-on-Trent South | |
|---|---|
| Borough constituency for the House of Commons | |
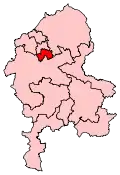
 Boundary of Stoke-on-Trent South in Staffordshire | |
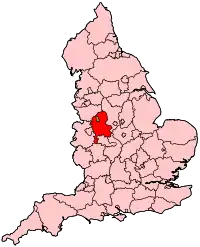
 Location of Staffordshire within England | |
| County | Staffordshire |
| Electorate | 68,624 (December 2010)[1] |
| Major settlements | Stoke-on-Trent |
| Current constituency | |
| Created | 1950 |
| Member of Parliament | Jack Brereton (Conservative) |
| Seats | One |
| Created from | Stoke-on-Trent/"Stoke" |
Jack Brereton MP | |
|---|---|
 Jack Brereton, MP for Stoke-on-Trent South since 2017 |
Previously a safe Labour seat, it is now held by the Conservatives by a majority of over 11,000, having gained the seat in the 2017 election and hugely increased their vote in the 2019 election.
Members of Parliament
| Election | Member[3] | Party | |
|---|---|---|---|
| 1950 | Ellis Smith | Labour | |
| 1966 | Jack Ashley | Labour | |
| 1992 | George Stevenson | Labour | |
| 2005 | Rob Flello | Labour | |
| 2017 | Jack Brereton | Conservative | |
Boundaries
2010–present: The City of Stoke-on-Trent wards of Blurton, Fenton, Longton North, Longton South, Meir Park and Sandon, Trentham and Hanford, and Weston and Meir North.
1983–2010: The City of Stoke-on-Trent wards of Blurton, Fenton Green, Great Fenton, Longton South, Meir Park, Trentham Park, and Weston.
1955–1983: The County Borough of Stoke-on-Trent wards numbers 17, 18, 19, 20, 21, 22, 23, and 24.
1950–1955: The County Borough of Stoke-on-Trent wards numbers 19, 20, 21, 22, 23, 24, 25, and 26.
Constituency profile
A former safe Labour seat, like the other Stoke-on-Trent constituencies, it includes the city's most middle-class electoral wards of Meir that contrast with much of the neighbouring, predominantly lower income, population of the other wards.[4]
The seat is home to Stoke City F.C. whose Bet365 Stadium is at the northern edge of the constituency.
Workless claimants, registered jobseekers, were in November 2012 equal to the regional average of 4.7% of the population based on a statistical compilation by The Guardian.[5]
History
Political history
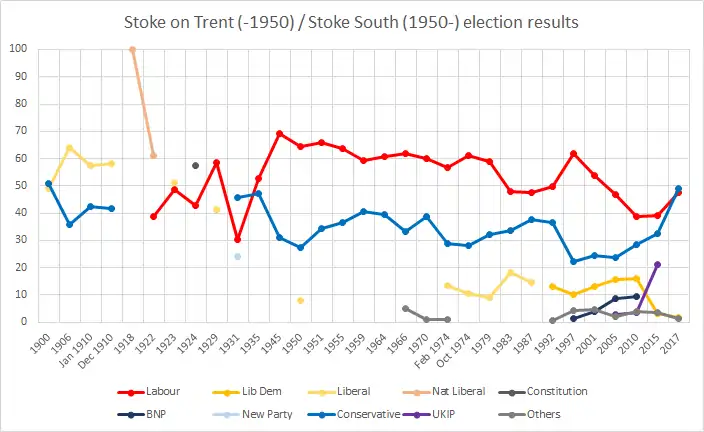
The constituency and its predecessor was a safe Labour seat from 1935 until the 2010s when it became marginal. It was won by the Conservative Party for the first time in 2017. At the 2019 general election, the Conservatives increased their majority to over 11,000 votes; with a vote share of 62%.
Prominent members
Jack Ashley (later Lord Ashley) became deaf as a result of an operation, but his disability campaigns led to major enactments and public sector changes to improve ordinary life for deaf people, including the inclusion of sign language in television programmes and campaigns to help other disabled people.
Elections

Elections in the 2010s
| Party | Candidate | Votes | % | ±% | |
|---|---|---|---|---|---|
| Conservative | Jack Brereton | 24,632 | 62.2 | +13.1 | |
| Labour | Mark McDonald | 13,361 | 33.7 | –13.8 | |
| Liberal Democrats | Rosalyn Gordon | 1,611 | 4.1 | +2.2 | |
| Majority | 11,271 | 28.5 | +26.9 | ||
| Turnout | 39,604 | 61.4 | –1.7 | ||
| Conservative hold | Swing | +13.4 | |||
| Party | Candidate | Votes | % | ±% | |
|---|---|---|---|---|---|
| Conservative | Jack Brereton | 20,451 | 49.1 | +16.4 | |
| Labour | Rob Flello | 19,788 | 47.5 | +8.3 | |
| Liberal Democrats | Ian Wilkes | 808 | 1.9 | –1.4 | |
| Green | Jan Zablocki | 643 | 1.5 | –1.1 | |
| Majority | 663 | 1.6 | N/A | ||
| Turnout | 41,690 | 63.1 | +5.8 | ||
| Conservative gain from Labour | Swing | +4.1 | |||
| Party | Candidate | Votes | % | ±% | |
|---|---|---|---|---|---|
| Labour | Rob Flello | 15,319 | 39.2 | +0.4 | |
| Conservative | Joe Rich | 12,780 | 32.7 | +4.3 | |
| UKIP | Tariq Mahmood | 8,298 | 21.2 | +17.8 | |
| Liberal Democrats | Peter Andras | 1,309 | 3.3 | –12.6 | |
| Green | Luke Bellamy | 1,029 | 2.6 | New | |
| TUSC | Matthew Wright | 372 | 1.0 | New | |
| Majority | 2,539 | 6.5 | –3.9 | ||
| Turnout | 39,107 | 57.3 | –1.5 | ||
| Labour hold | Swing | –2.0 | |||
| Party | Candidate | Votes | % | ±% | |
|---|---|---|---|---|---|
| Labour | Rob Flello | 15,446 | 38.8 | –8.1 | |
| Conservative | James Rushton | 11,316 | 28.4 | +4.2 | |
| Liberal Democrats | Zulfiqar Ali | 6,323 | 15.9 | +0.8 | |
| BNP | Michael Coleman | 3,762 | 9.4 | +0.4 | |
| UKIP | Mark Barlow | 1,363 | 3.4 | +0.7 | |
| Staffordshire Independent Group | Terry Follows | 1,208 | 3.0 | New | |
| Independent | Mark Breeze | 434 | 1.1 | New | |
| Majority | 4,130 | 10.4 | –12.6 | ||
| Turnout | 39,852 | 58.8 | +4.4 | ||
| Labour hold | Swing | –6.2 | |||
Elections in the 2000s
| Party | Candidate | Votes | % | ±% | |
|---|---|---|---|---|---|
| Labour | Rob Flello | 17,727 | 46.9 | –6.9 | |
| Conservative | Mark Deaville | 9,046 | 23.9 | –0.7 | |
| Liberal Democrats | Andrew Martin | 5,894 | 15.6 | +2.5 | |
| BNP | Mark Leat | 3,305 | 8.7 | +4.9 | |
| UKIP | Neville Benson | 1,043 | 2.8 | New | |
| Veritas | Grant Allen | 805 | 2.1 | New | |
| Majority | 8,618 | 23.0 | –6.2 | ||
| Turnout | 37,820 | 53.6 | +2.2 | ||
| Labour hold | Swing | –3.1 | |||
| Party | Candidate | Votes | % | ±% | |
|---|---|---|---|---|---|
| Labour | George Stevenson | 19,366 | 53.8 | –8.2 | |
| Conservative | Philip Bastiman | 8,877 | 24.6 | +2.2 | |
| Liberal Democrats | Christopher Coleman | 4,724 | 13.1 | +2.9 | |
| Independent | Adrian Knapper | 1,703 | 4.7 | New | |
| BNP | Steven Batkin | 1,358 | 3.8 | +2.6 | |
| Majority | 10,489 | 29.2 | –10.4 | ||
| Turnout | 36,028 | 51.4 | –14.7 | ||
| Labour hold | Swing | –5.2 | |||
Elections in the 1990s
| Party | Candidate | Votes | % | ±% | |
|---|---|---|---|---|---|
| Labour | George Stevenson | 28,645 | 62.0 | +12.2 | |
| Conservative | Sheila Scott | 10,342 | 22.4 | –14.3 | |
| Liberal Democrats | Peter Barnett | 4,710 | 10.2 | +2.8 | |
| Referendum | Richard Adams | 1,103 | 2.4 | New | |
| Liberal | Alison Micklem | 580 | 1.3 | New | |
| BNP | Steven Batkin | 568 | 1.2 | New | |
| National Democrats | Brian Lawrence | 288 | 0.6 | New | |
| Majority | 18,303 | 39.6 | +26.5 | ||
| Turnout | 46,236 | 66.1 | –8.2 | ||
| Labour hold | Swing | +13.3 | |||
| Party | Candidate | Votes | % | ±% | |
|---|---|---|---|---|---|
| Labour | George Stevenson | 26,380 | 49.8 | +2.3 | |
| Conservative | Roger M. Ibbs | 19,471 | 36.7 | –1.1 | |
| Liberal Democrats | Fred A. Jones | 6,870 | 13.0 | –1.7 | |
| Natural Law | Elizabeth A. Lines | 291 | 0.5 | New | |
| Majority | 6,909 | 13.1 | +3.4 | ||
| Turnout | 53,012 | 74.3 | +0.6 | ||
| Labour hold | Swing | +1.7 | |||
Elections of the 1980s
| Party | Candidate | Votes | % | ±% | |
|---|---|---|---|---|---|
| Labour | Jack Ashley | 24,794 | 47.5 | ||
| Conservative | Dennis Hartshorne | 19,741 | 37.8 | ||
| Liberal | Peter Wild | 7,669 | 14.69 | ||
| Majority | 5,053 | 9.68 | |||
| Turnout | 52,204 | 73.73 | |||
| Labour hold | Swing | ||||
| Party | Candidate | Votes | % | ±% | |
|---|---|---|---|---|---|
| Labour | Jack Ashley | 23,611 | 48.0 | -10.8 | |
| Conservative | P Maxwell | 16,506 | 33.6 | +1.3 | |
| Liberal | W Walley | 9,050 | 18.4 | +9.4 | |
| Majority | 7,105 | 14.4 | -12.1 | ||
| Turnout | 49,167 | 69.6 | -2.9 | ||
| Labour hold | Swing | -6.0 | |||
Elections of the 1970s
| Party | Candidate | Votes | % | ±% | |
|---|---|---|---|---|---|
| Labour | Jack Ashley | 31,610 | 58.75 | ||
| Conservative | R Rayner | 17,364 | 32.27 | ||
| Liberal | D Chantrey | 4,829 | 8.98 | ||
| Majority | 14,246 | 26.48 | |||
| Turnout | 53,803 | 72.52 | |||
| Labour hold | Swing | ||||
| Party | Candidate | Votes | % | ±% | |
|---|---|---|---|---|---|
| Labour | Jack Ashley | 30,699 | 61.18 | ||
| Conservative | S Heath | 14,204 | 28.31 | ||
| Liberal | E Johnson | 5,278 | 10.52 | ||
| Majority | 16,495 | 32.87 | |||
| Turnout | 50,181 | 69.09 | |||
| Labour hold | Swing | ||||
| Party | Candidate | Votes | % | ±% | |
|---|---|---|---|---|---|
| Labour | Jack Ashley | 31,650 | 56.83 | ||
| Conservative | S Newall | 15,981 | 28.70 | ||
| Liberal | M Smith | 7,578 | 13.61 | New | |
| Communist | S Lomas | 481 | 0.86 | ||
| Majority | 15,669 | 28.13 | |||
| Turnout | 55,690 | 77.38 | |||
| Labour hold | Swing | ||||
| Party | Candidate | Votes | % | ±% | |
|---|---|---|---|---|---|
| Labour | Jack Ashley | 20,770 | 60.24 | ||
| Conservative | RJ Apps | 13,344 | 38.70 | ||
| Communist | SJ Lomas | 364 | 1.06 | ||
| Majority | 7,426 | 21.54 | |||
| Turnout | 34,478 | 50.66 | |||
| Labour hold | Swing | ||||
Elections of the 1960s
| Party | Candidate | Votes | % | ±% | |
|---|---|---|---|---|---|
| Labour | Jack Ashley | 27,380 | 61.65 | ||
| Conservative | FW Thornton | 14,769 | 33.26 | ||
| Communist | SJ Lomas | 2,262 | 5.09 | New | |
| Majority | 12,611 | 28.39 | |||
| Turnout | 44,411 | 71.02 | |||
| Labour hold | Swing | ||||
| Party | Candidate | Votes | % | ±% | |
|---|---|---|---|---|---|
| Labour | Ellis Smith | 28,928 | 60.56 | ||
| Conservative | Clive Howson | 18,839 | 39.44 | ||
| Majority | 10,089 | 21.12 | |||
| Turnout | 47,767 | 75.65 | |||
| Labour hold | Swing | ||||
Elections of the 1950s
| Party | Candidate | Votes | % | ±% | |
|---|---|---|---|---|---|
| Labour | Ellis Smith | 29,578 | 59.28 | ||
| Conservative | Geoffrey S Tucker | 20,318 | 40.72 | ||
| Majority | 9,260 | 18.56 | |||
| Turnout | 49,896 | 78.24 | |||
| Labour hold | Swing | ||||
| Party | Candidate | Votes | % | ±% | |
|---|---|---|---|---|---|
| Labour | Ellis Smith | 31,003 | 63.61 | ||
| Conservative | Basil GC Webb | 17,739 | 36.39 | ||
| Majority | 13,264 | 27.22 | |||
| Turnout | 48,742 | 73.62 | |||
| Labour hold | Swing | ||||
| Party | Candidate | Votes | % | ±% | |
|---|---|---|---|---|---|
| Labour | Ellis Smith | 35,261 | 65.77 | ||
| Conservative | Basil Webb | 18,355 | 34.23 | ||
| Majority | 16,906 | 31.54 | |||
| Turnout | 53,616 | 84.21 | |||
| Labour hold | Swing | ||||
| Party | Candidate | Votes | % | ±% | |
|---|---|---|---|---|---|
| Labour | Ellis Smith | 34,339 | 64.45 | ||
| Conservative | L Orridge | 14,637 | 27.47 | ||
| Liberal | William Herbert Kemp | 4,307 | 8.08 | ||
| Majority | 19,702 | 36.98 | |||
| Turnout | 53,283 | 85.27 | |||
| Labour win (new seat) | |||||
Notes
- A borough constituency (for the purposes of election expenses and type of returning officer)
- As with all constituencies, the constituency elects one Member of Parliament (MP) by the first past the post system of election at least every five years.
References
- "Electorate Figures – Boundary Commission for England". 2011 Electorate Figures. Boundary Commission for England. 4 March 2011. Archived from the original on 6 November 2010. Retrieved 13 March 2011.
- Brereton's was 1 of 6 total gains offset by greater losses (13 net seats lost) for his party in the 2017 results nationwide. In 2017 the two largest parties increased their share of the vote largely in England at the expense of UKIP.
- Leigh Rayment's Historical List of MPs – Constituencies beginning with "S" (part 5)
- "Local statistics – Office for National Statistics". neighbourhood.statistics.gov.uk.
- Unemployment claimants by constituency The Guardian
- "Stoke-on-Trent South Parliamentary constituency". BBC News. Retrieved 30 November 2019.
- "Stoke-on-Trent South". BBC News. Retrieved 9 June 2017.
- "Election Data 2015". Electoral Calculus. Archived from the original on 17 October 2015. Retrieved 17 October 2015.
- "Candidates (PPCS) for Stoke-on-Trent South in the UK 2015 General Ele…". Archived from the original on 26 April 2015. Retrieved 26 April 2015.
- "Peter Andras PPC page". Liberal Democrats. Retrieved 1 March 2015.
- "MORE TUSC CANDIDATES IN PLACE AS ELECTION CHALLENGE GROWS". www.tusc.org.uk.
- "Election Data 2010". Electoral Calculus. Archived from the original on 26 July 2013. Retrieved 17 October 2015.
- "Statement of Persons Nominated".
- "Election Data 2005". Electoral Calculus. Archived from the original on 15 October 2011. Retrieved 18 October 2015.
- "BBC NEWS - Election 2005 - Results - Stoke-on-Trent South". BBC News.
- "Election Data 2001". Electoral Calculus. Archived from the original on 15 October 2011. Retrieved 18 October 2015.
- "BBC NEWS - VOTE 2001 - RESULTS & CONSTITUENCIES - Stoke-on-Trent South". BBC News.
- "Election Data 1997". Electoral Calculus. Archived from the original on 15 October 2011. Retrieved 18 October 2015.
- "BBC - Error 404 : Not Found". Archived from the original on 28 October 2004.
- "Election Data 1992". Electoral Calculus. Archived from the original on 15 October 2011. Retrieved 18 October 2015.
- "UK General Election results April 1992". Richard Kimber's Political Science Resources. Politics Resources. 9 April 1992. Retrieved 6 December 2010.
- "Election Data 1987". Electoral Calculus. Archived from the original on 15 October 2011. Retrieved 18 October 2015.
- "Election Data 1983". Electoral Calculus. Archived from the original on 15 October 2011. Retrieved 18 October 2015.