Siquijor, Siquijor
Siquijor, officially the Municipality of Siquijor (Cebuano: Lungsod sa Siquijor; Tagalog: Bayan ng Siquijor), is a 4th class municipality and capital of the province of Siquijor, Philippines. According to the 2020 census, it has a population of 28,915 people.[3]
Siquijor | |
|---|---|
| Municipality of Siquijor | |
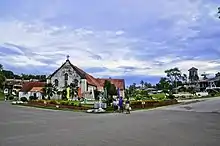
 Siquijor Town Hall | |
 Flag | |
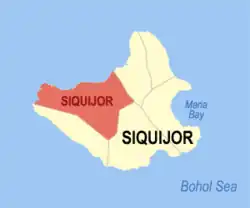
 Map of Siquijor with Siquijor highlighted | |
OpenStreetMap | |
.svg.png.webp) Siquijor Location within the Philippines | |
| Coordinates: 9°12′54″N 123°30′50″E | |
| Country | Philippines |
| Region | Central Visayas |
| Province | Siquijor |
| District | Lone district |
| Barangays | 42 (see Barangays) |
| Government | |
| • Type | Sangguniang Bayan |
| • Mayor | Richard C. Quezon (PDPLBN) |
| • Vice Mayor | Teodoro G. Jumawan Jr. (PDPLBN) |
| • Representative | Zaldy S. Villa |
| • Municipal Council | Members |
| • Electorate | 21,879 voters (2022) |
| Area | |
| • Total | 90.70 km2 (35.02 sq mi) |
| Elevation | 29 m (95 ft) |
| Highest elevation | 601 m (1,972 ft) |
| Lowest elevation | 0 m (0 ft) |
| Population (2020 census)[3] | |
| • Total | 28,915 |
| • Density | 320/km2 (830/sq mi) |
| • Households | 7,358 |
| Economy | |
| • Income class | 4th municipal income class |
| • Poverty incidence | 13.10 |
| • Revenue | ₱ 133.4 million (2020) |
| • Assets | ₱ 377.6 million (2020) |
| • Expenditure | ₱ 144.5 million (2020) |
| • Liabilities | ₱ 74.12 million (2020) |
| Service provider | |
| • Electricity | Province of Siquijor Electric Cooperative (PROSIELCO) |
| Time zone | UTC+8 (PST) |
| ZIP code | 6225 |
| PSGC | |
| IDD : area code | +63 (0)35 |
| Native languages | Cebuano Tagalog |
History
While Spanish priests arrived in Siquijor as early as 1780, it was not until 1794 that the town became a municipality, the same year the parish was established.[5]
Cityhood
In the 19th Congress of the Philippines, house bills were filed by various representatives which seeks Siquijor including other capital towns of provinces with no current component cities, independent component cities or highly urbanized cities to automatically convert into cities.[6][7][8]
Geography
Barangays
Siquijor is politically subdivided into 42 barangays. Each barangay consists of puroks and some have sitios.
| PSGC | Barangay | Population | ±% p.a. | |||
|---|---|---|---|---|---|---|
| 2020[3] | 2010[9] | |||||
| 076106001 | Banban | 2.7% | 791 | 778 | 0.17% | |
| 076106002 | Bolos | 0.9% | 270 | 252 | 0.69% | |
| 076106003 | Caipilan | 3.9% | 1,126 | 1,000 | 1.19% | |
| 076106004 | Caitican | 1.6% | 476 | 444 | 0.70% | |
| 076106005 | Calalinan | 2.5% | 711 | 675 | 0.52% | |
| 076106007 | Canal | 1.6% | 472 | 433 | 0.87% | |
| 076106008 | Candanay Norte | 3.3% | 943 | 886 | 0.63% | |
| 076106009 | Candanay Sur | 3.4% | 991 | 885 | 1.14% | |
| 076106010 | Cang‑adieng | 1.0% | 293 | 256 | 1.36% | |
| 076106011 | Cang‑agong | 3.1% | 901 | 879 | 0.25% | |
| 076106012 | Cang‑alwang | 2.6% | 766 | 731 | 0.47% | |
| 076106013 | Cang‑asa | 3.1% | 900 | 863 | 0.42% | |
| 076106006 | Cang‑atuyom | 1.4% | 398 | 307 | 2.63% | |
| 076106014 | Cang‑inte | 0.7% | 211 | 215 | −0.19% | |
| 076106015 | Cang‑isad | 0.6% | 171 | 142 | 1.88% | |
| 076106016 | Canghunoghunog | 0.9% | 268 | 247 | 0.82% | |
| 076106017 | Cangmatnog | 0.7% | 189 | 185 | 0.21% | |
| 076106018 | Cangmohao | 0.8% | 225 | 177 | 2.43% | |
| 076106019 | Cantabon | 1.7% | 480 | 497 | −0.35% | |
| 076106020 | Caticugan | 3.4% | 973 | 842 | 1.46% | |
| 076106021 | Dumanhog | 2.3% | 652 | 557 | 1.59% | |
| 076106022 | Ibabao | 1.0% | 293 | 312 | −0.63% | |
| 076106023 | Lambojon | 1.0% | 290 | 298 | −0.27% | |
| 076106024 | Luyang | 2.5% | 722 | 704 | 0.25% | |
| 076106025 | Luzong | 1.6% | 476 | 445 | 0.68% | |
| 076106026 | Olo | 2.5% | 736 | 754 | −0.24% | |
| 076106027 | Pangi | 5.5% | 1,594 | 1,491 | 0.67% | |
| 076106028 | Panlautan | 0.8% | 235 | 224 | 0.48% | |
| 076106029 | Pasihagon | 3.8% | 1,088 | 1,003 | 0.82% | |
| 076106030 | Pili | 1.4% | 395 | 353 | 1.13% | |
| 076106031 | Poblacion | 3.8% | 1,088 | 1,596 | −3.76% | |
| 076106032 | Polangyuta | 1.4% | 395 | 781 | −6.59% | |
| 076106033 | Ponong | 5.8% | 1,673 | 828 | 7.29% | |
| 076106034 | Sabang | 3.1% | 885 | 554 | 4.79% | |
| 076106035 | San Antonio | 3.0% | 868 | 773 | 1.17% | |
| 076106036 | Songculan | 2.0% | 568 | 245 | 8.77% | |
| 076106037 | Tacdog | 1.8% | 525 | 509 | 0.31% | |
| 076106038 | Tacloban | 2.1% | 616 | 636 | −0.32% | |
| 076106039 | Tambisan | 2.6% | 738 | 684 | 0.76% | |
| 076106040 | Tebjong | 0.7% | 212 | 209 | 0.14% | |
| 076106041 | Tinago | 3.5% | 1,025 | 971 | 0.54% | |
| 076106042 | Tongo | 2.3% | 670 | 610 | 0.94% | |
| Total | 28,915 | 25,231 | 1.37% | |||
Climate
| Climate data for Siquijor, Siquijor | |||||||||||||
|---|---|---|---|---|---|---|---|---|---|---|---|---|---|
| Month | Jan | Feb | Mar | Apr | May | Jun | Jul | Aug | Sep | Oct | Nov | Dec | Year |
| Average high °C (°F) | 29 (84) |
30 (86) |
31 (88) |
32 (90) |
31 (88) |
30 (86) |
30 (86) |
30 (86) |
30 (86) |
29 (84) |
29 (84) |
29 (84) |
30 (86) |
| Average low °C (°F) | 22 (72) |
22 (72) |
22 (72) |
23 (73) |
24 (75) |
24 (75) |
24 (75) |
24 (75) |
24 (75) |
24 (75) |
23 (73) |
23 (73) |
23 (74) |
| Average precipitation mm (inches) | 26 (1.0) |
22 (0.9) |
28 (1.1) |
41 (1.6) |
95 (3.7) |
136 (5.4) |
147 (5.8) |
126 (5.0) |
132 (5.2) |
150 (5.9) |
98 (3.9) |
46 (1.8) |
1,047 (41.3) |
| Average rainy days | 7.5 | 6.7 | 8.9 | 10.4 | 21.6 | 25.6 | 26.3 | 25.0 | 24.1 | 26.2 | 19.2 | 12.1 | 213.6 |
| Source: Meteoblue (modeled/calculated data, not measured locally)[10] | |||||||||||||
Demographics

|
| |||||||||||||||||||||||||||||||||||||||||||||||||||
| Source: Philippine Statistics Authority[11][9][12][13] | ||||||||||||||||||||||||||||||||||||||||||||||||||||
Economy

The major economic activities include farming, fishing, woodcraft and furniture making, basket making, peanut processing, banana chips processing, and bakery.[5]
Transportation
Although Larena has the larger port on the island, the harbour of Siquijor provides daily ferry services to Dumaguete in Negros Oriental. The island's only aerodrome, Siquijor Airport, is located in barangay Cang‑alwang wherein the only airline operating is Air Juan flying Cebu-Siqujor-Cebu route three times a week.
Education
The public schools in the town of Siquijor are administered by two school districts under the Schools Division of Siquijor.
Elementary schools:
- Banban Elementary School — Luyang
- Bolos Elementary School — Bolos
- Caipilan Elementary School — Caipilan
- Candanay Elementary School — Candanay
- Cang-agong Elementary School — Cang-agong
- Cang-alwang Elementary School — Tongo
- Cang-asa Elementary School — Cang-asa
- Cang-atuyom Elementary School — Cang-atuyom
- Ibabao Elementary School — Ibabao
- Luzong Elementary School — Luzong
- Pangi Elementary School — Pangi
- Ponong Elementary School — Ponong
- San Antonio Elementary School — San Antonio
High schools:
- Banban National High School — Banban
- Cang-alwang National High School — Tongo
- Ponong High School — Ponong
- San Antonio National High School — San Antonio
- Siquijor Provincial Science High School — Tongo
Integrated schools:
- Siquijor Integrated School (formerly Siquijor CES) — Polangyuta
Private schools:
- Assisi High School of Siquijor, Inc. — Sta. Fe Street, Poblacion
- Quezon Memorial Institute of Siquijor, Inc. — Canal
References
- Municipality of Siquijor | (DILG)
- "2015 Census of Population, Report No. 3 – Population, Land Area, and Population Density" (PDF). Philippine Statistics Authority. Quezon City, Philippines. August 2016. ISSN 0117-1453. Archived (PDF) from the original on May 25, 2021. Retrieved July 16, 2021.
- Census of Population (2020). "Region VII (Central Visayas)". Total Population by Province, City, Municipality and Barangay. Philippine Statistics Authority. Retrieved July 8, 2021.
- "PSA Releases the 2018 Municipal and City Level Poverty Estimates". Philippine Statistics Authority. December 15, 2021. Retrieved January 22, 2022.
- "Municipality of Siquijor". Provincial Government of Siquijor. Archived from the original on December 13, 2011. Retrieved November 17, 2015.
{{cite web}}: CS1 maint: unfit URL (link) - Yap, Eric (June 30, 2022). "AN ACT AUTOMATICALLY CONVERTING THE CAPITAL TOWN OF PROVINCES WITH NO COMPONENT CITIES, INDEPENDENT COMPONENT CITIES OR HIGHLY URBANIZED CITIES WITHIN ITS TERRITORIAL JURISDICTION, INTO A COMPONENT CITY" (PDF). House of Representatives of the Philippines. Retrieved April 1, 2023.
- Palma, Wilter (August 9, 2022). "AN ACT AUTOMATICALLY CONVERTING THE CAPITAL TOWN OF PROVINCES WITH NO COMPONENT CITIES, INDEPENDENT COMPONENT CITIES, OR HIGHLY URBANIZED CITIES WITHIN ITS TERRITORIAL JURISDICTION, INTO A COMPONENT CITY" (PDF). House of Representatives of the Philippines. Retrieved April 1, 2023.
- Daza, Paul (August 11, 2022). "AN ACT CONVERING INTO COMPONENT CITIES THE CAPITAL TOWNS OF PROVINCES WITHOUT A CITY, AMENDING FOR THE PURPOSE SECTION 450 OF REPUBLIC ACT NO. 7610, AS AMENDED BY REPUBLIC ACT NO. 9009, OTHERWISE KNOWN AS THE LOCAL GOVERNMENT CODE OF 1991, AND FOR OTHER PURPOSES" (PDF). House of Representatives of the Philippines. Retrieved April 1, 2023.
- Census of Population and Housing (2010). "Region VII (Central Visayas)". Total Population by Province, City, Municipality and Barangay. National Statistics Office. Retrieved June 29, 2016.
- "Siquijor: Average Temperatures and Rainfall". Meteoblue. Retrieved April 28, 2020.
- Census of Population (2015). "Region VII (Central Visayas)". Total Population by Province, City, Municipality and Barangay. Philippine Statistics Authority. Retrieved June 20, 2016.
- Censuses of Population (1903–2007). "Region VII (Central Visayas)". Table 1. Population Enumerated in Various Censuses by Province/Highly Urbanized City: 1903 to 2007. National Statistics Office.
- "Province of Siquijor". Municipality Population Data. Local Water Utilities Administration Research Division. Retrieved December 17, 2016.
- "Poverty incidence (PI):". Philippine Statistics Authority. Retrieved December 28, 2020.
- "Estimation of Local Poverty in the Philippines" (PDF). Philippine Statistics Authority. November 29, 2005.
- "2003 City and Municipal Level Poverty Estimates" (PDF). Philippine Statistics Authority. March 23, 2009.
- "City and Municipal Level Poverty Estimates; 2006 and 2009" (PDF). Philippine Statistics Authority. August 3, 2012.
- "2012 Municipal and City Level Poverty Estimates" (PDF). Philippine Statistics Authority. May 31, 2016.
- "Municipal and City Level Small Area Poverty Estimates; 2009, 2012 and 2015". Philippine Statistics Authority. July 10, 2019.
- "PSA Releases the 2018 Municipal and City Level Poverty Estimates". Philippine Statistics Authority. December 15, 2021. Retrieved January 22, 2022.