Scunthorpe (UK Parliament constituency)
Scunthorpe is a constituency[n 1] represented in the House of Commons of the UK Parliament since 2019 by Holly Mumby-Croft, a member of the Conservative Party, when she gained the seat from the Labour Party.[n 2]
| Scunthorpe | |
|---|---|
| County constituency for the House of Commons | |
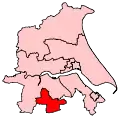
 Boundary of Scunthorpe in Humberside | |
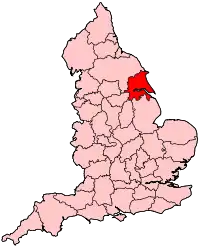
 Location of Humberside within England | |
| County | North Lincolnshire |
| Electorate | 60,345 (December 2019)[1] |
| Major settlements | Scunthorpe and Bottesford |
| Current constituency | |
| Created | 1997 |
| Member of Parliament | Holly Mumby-Croft (Conservative) |
| Seats | One |
| Created from | Glanford & Scunthorpe |
Boundaries
1997–2010: The Borough of Scunthorpe, and the Borough of Glanford wards of Bottesford Central, Bottesford East, Bottesford West, Kirton, Messingham, and South Ancholme.
2010–present: The Borough of North Lincolnshire wards of Ashby, Bottesford, Brumby, Crosby and Park, Frodingham, Kingsway with Lincoln Gardens, Ridge, and Town.
The constituency includes the whole of Scunthorpe, Bottesford, Yaddlethorpe, Messingham, Manton, Kirton-in-Lindsey, Redbourne, Hibaldstow, Cadney and the hamlets and communities within these parishes.
History
Although there was talk in a local newspaper in the 1930s that the town of Scunthorpe should have a parliamentary constituency named after it, it was only after the boundary reviews implemented in 1997 that a constituency of this name was created. Previous incarnations of a constituency containing the steel town and small towns and villages around it had been called (going backwards in time) Glanford and Scunthorpe, Brigg and Scunthorpe, and Brigg.
Constituency profile
Results to date indicate that the constituency has changed since creation from a safe seat for the Labour Party created at the incoming election for Prime Minister Tony Blair to somewhat of a marginal majority area for the party.
- In statistics
The constituency consists of Census Output Areas of a local government district with: a working population whose income is below the national average and slightly higher than average reliance upon social housing.[2] At the end of 2012 the unemployment rate in the constituency stood as 5.7% of the population claiming jobseekers allowance, compared to the regional average of 4.7%.[3] The borough contributing to the seat had a middling 20.7% of its population without a car, 26.2% of the population without qualifications and 19.5% with level 4 qualifications or above. In terms of tenure 69.5% of homes are owned outright or on a mortgage as at the 2011 census across the district.[4]
Members of Parliament
Nic Dakin was elected in the 2010 general election with a lower share of the vote than achieved under the Blair Ministry by his predecessor, with 39.5% of the votes.
| Election | Member[5] | Party | |
|---|---|---|---|
| 1997 | Elliot Morley | Labour | |
| 2010 | Nic Dakin | Labour | |
| 2019 | Holly Mumby-Croft | Conservative | |
Elections
Elections in the 2010s
| Party | Candidate | Votes | % | ±% | |
|---|---|---|---|---|---|
| Conservative | Holly Mumby-Croft | 20,306 | 53.8 | +10.3 | |
| Labour | Nic Dakin | 13,855 | 36.7 | -15.3 | |
| Brexit Party | Jerry Gorman | 2,044 | 5.4 | New | |
| Liberal Democrats | Ryk Downes | 875 | 2.3 | +0.9 | |
| Green | Peter Dennington | 670 | 1.8 | New | |
| Majority | 6,451 | 17.1 | N/A | ||
| Turnout | 37,750 | 60.9 | -4.4 | ||
| Conservative gain from Labour | Swing | +12.8 | |||
| Party | Candidate | Votes | % | ±% | |
|---|---|---|---|---|---|
| Labour | Nic Dakin | 20,916 | 52.0 | +10.3 | |
| Conservative | Holly Mumby-Croft | 17,485 | 43.5 | +10.3 | |
| UKIP | Andy Talliss | 1,247 | 3.1 | -14.0 | |
| Liberal Democrats | Ryk Downes | 554 | 1.4 | -0.7 | |
| Majority | 3,431 | 8.5 | 0.0 | ||
| Turnout | 40,202 | 65.3 | +7.6 | ||
| Labour hold | Swing | 0.0 | |||
| Party | Candidate | Votes | % | ±% | |
|---|---|---|---|---|---|
| Labour | Nic Dakin | 15,393 | 41.7 | +2.2 | |
| Conservative | Jo Gideon | 12,259 | 33.2 | +0.6 | |
| UKIP | Stephen Howd | 6,329 | 17.1 | +12.5 | |
| Independent | Des Comerford | 1,097 | 3.0 | New | |
| Green | Martin Dwyer | 887 | 2.4 | +1.3 | |
| Liberal Democrats | Simon Dodd | 770 | 2.1 | -16.2 | |
| Independent | Paul Elsom | 206 | 0.6 | New | |
| Majority | 3,134 | 8.5 | +1.6 | ||
| Turnout | 36,941 | 57.7 | -1.0 | ||
| Labour hold | Swing | +0.8 | |||
| Party | Candidate | Votes | % | ±% | |
|---|---|---|---|---|---|
| Labour | Nic Dakin | 14,640 | 39.5 | -12.5 | |
| Conservative | Caroline Johnson | 12,091 | 32.6 | +5.8 | |
| Liberal Democrats | Neil Poole | 6,774 | 18.3 | +1.2 | |
| UKIP | Jane Collins | 1,686 | 4.6 | +0.5 | |
| BNP | Douglas Ward | 1,447 | 3.9 | New | |
| Green | Natalie Hurst | 396 | 1.1 | New | |
| Majority | 2,549 | 6.9 | -20.5 | ||
| Turnout | 37,034 | 58.7 | +4.3 | ||
| Labour hold | Swing | -9.2 | |||
Elections in the 2000s
| Party | Candidate | Votes | % | ±% | |
|---|---|---|---|---|---|
| Labour | Elliot Morley | 17,355 | 53.1 | -6.7 | |
| Conservative | Julian Sturdy | 8,392 | 25.7 | -3.2 | |
| Liberal Democrats | Neil Poole | 5,556 | 17.0 | +7.6 | |
| UKIP | David Baxendale | 1,361 | 4.2 | New | |
| Majority | 8,963 | 27.4 | -3.5 | ||
| Turnout | 32,664 | 54.3 | -2.0 | ||
| Labour hold | Swing | -1.7 | |||
| Party | Candidate | Votes | % | ±% | |
|---|---|---|---|---|---|
| Labour | Elliot Morley | 20,096 | 59.8 | -0.6 | |
| Conservative | Bernard Theobald | 9,724 | 28.9 | +2.6 | |
| Liberal Democrats | Bob Tress | 3,156 | 9.4 | +1.0 | |
| Independent | Michael Cliff | 347 | 1.0 | New | |
| Independent | David Patterson | 302 | 0.9 | New | |
| Majority | 10,372 | 30.9 | -3.2 | ||
| Turnout | 33,625 | 56.3 | -12.5 | ||
| Labour hold | Swing | -1.6 | |||
Elections in the 1990s
| Party | Candidate | Votes | % | ±% | |
|---|---|---|---|---|---|
| Labour | Elliot Morley | 25,107 | 60.4 | ||
| Conservative | Martyn Fisher | 10,934 | 26.3 | ||
| Liberal Democrats | Gordon Smith | 3,497 | 8.4 | ||
| Referendum | Paul Smith | 1,637 | 3.9 | ||
| Socialist Labour | Brian Hopper | 399 | 1.0 | ||
| Majority | 14,173 | 34.1 | |||
| Turnout | 41,574 | 68.8 | |||
| Labour win (new seat) | |||||
Notes
- A county constituency (for the purposes of election expenses and type of returning officer)
- As with all constituencies, the constituency elects one Member of Parliament (MP) by the first past the post system of election at least every five years.
References
- "Constituency data: electorates – House of Commons Library". Parliament UK. 15 June 2020. Retrieved 22 July 2020.
- "Local statistics - Office for National Statistics". www.ons.gov.uk.
- Unemployment claimants by constituency The Guardian
- "2011 census interactive maps". Archived from the original on 29 January 2016.
- Leigh Rayment's Historical List of MPs – Constituencies beginning with "S" (part 2)
- "North Lincolnshire Council | General Election 2019 candidates for Scunthorpe". Retrieved 25 November 2019.
- "Scunthorpe parliamentary constituency". BBC News.
- "Election Data 2015". Electoral Calculus. Archived from the original on 17 October 2015. Retrieved 17 October 2015.
- "Scunthorpe". BBC News. Retrieved 14 May 2015.
- "Election Data 2010". Electoral Calculus. Archived from the original on 26 July 2013. Retrieved 17 October 2015.
- "UK > England > Yorkshire and the Humber > Scunthorpe". Election 2010. BBC. 7 May 2010. Retrieved 12 May 2010.
- "Election Data 2005". Electoral Calculus. Archived from the original on 15 October 2011. Retrieved 18 October 2015.
- "Election Data 2001". Electoral Calculus. Archived from the original on 15 October 2011. Retrieved 18 October 2015.
- "Election Data 1997". Electoral Calculus. Archived from the original on 15 October 2011. Retrieved 18 October 2015.