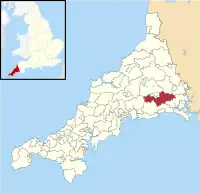
Menheniot (electoral division)
Menheniot (Cornish: Mahynyet)[1] was an electoral division of Cornwall in the United Kingdom which returned one member to sit on Cornwall Council between 2009 and 2021. It was abolished at the 2021 local elections, being split between the new divisions of Lynher, St Cleer and Menheniot, Looe East and Deviock, and Liskeard South and Dobwalls.
| Menheniot | |
|---|---|
| Former ward Cornwall Council. | |
 Boundary of Menheniot in Cornwall from 2013-2021. | |
| County | Cornwall |
| 2013–2021 | |
| Number of councillors | One |
| Replaced by | Lynher St Cleer and Menheniot Looe East and Deviock Liskeard South and Dobwalls |
| Created from | Menheniot |
| 2009–2013 | |
| Number of councillors | One |
| Replaced by | Menheniot |
| Created from | Council created |
Councillors
| Election | Member | Party | |
|---|---|---|---|
| 2009 | Bernie Ellis | Conservative | |
| 2013 | |||
| 2016 by-election | Phil Seeva | ||
| 2017 | |||
| 2021 | Seat abolished | ||
Extent
Menheniot represented the villages of East Taphouse, Doublebois, St Keyne, Merrymeet, Menheniot and Quethiock, and the hamlets of Redpost, Treburgie Water, Trevelmond, St Pinnock, Trewidland, Horningtops, Pengover Green, Lower Clicker, Doddycross, Trehunist and Blunts. The village of Herodsfoot was shared with the Trelawny division.[2]
The division was nominally abolished during boundary changes at the 2013 election, but this had little effect on the ward. Both before and after the boundary changes, the division covered 8,644 hectares in total.[2][3]
Election results
2017 election
| Party | Candidate | Votes | % | ±% | |
|---|---|---|---|---|---|
| Conservative | Phil Seeva | 834 | 53.9 | ||
| Liberal Democrats | Charles Boney | 701 | 45.3 | ||
| Majority | 133 | 8.6 | |||
| Rejected ballots | 11 | 0.7 | |||
| Turnout | 1546 | 48.7 | |||
| Conservative hold | Swing | ||||
2016 by-election
| Party | Candidate | Votes | % | ±% | |
|---|---|---|---|---|---|
| Conservative | Phil Seeva | 532 | 40.5 | ||
| Liberal Democrats | Charles Boney | 472 | 35.9 | ||
| UKIP | Duncan Odgers | 177 | 13.5 | ||
| Labour | Martin Menear | 67 | 5.1 | ||
| Green | Richard Sedgley | 65 | 4.9 | ||
| Majority | 60 | 4.6 | |||
| Rejected ballots | 1 | 0.8 | |||
| Turnout | 1314 | 42.4 | |||
| Conservative hold | Swing | ||||
2013 election
| Party | Candidate | Votes | % | ±% | |
|---|---|---|---|---|---|
| Conservative | Bernie Ellis | 549 | 37.7 | ||
| UKIP | David Clue | 450 | 30.9 | ||
| Liberal Democrats | Charles Boney | 352 | 24.1 | ||
| Green | Richard Sedgley | 93 | 6.4 | ||
| Majority | 99 | 6.8 | |||
| Rejected ballots | 14 | 1.0 | |||
| Turnout | 1458 | 46.2 | |||
| Conservative hold | Swing | ||||
2009 election
| Party | Candidate | Votes | % | ±% | |
|---|---|---|---|---|---|
| Conservative | Bernie Ellis | 746 | 47.1 | ||
| Liberal Democrats | Anthony Francis | 433 | 27.4 | ||
| UKIP | David Clue | 389 | 24.6 | ||
| Majority | 313 | 19.8 | |||
| Rejected ballots | 15 | 0.9 | |||
| Turnout | 1583 | 50.6 | |||
| Conservative win (new seat) | |||||
References
- "Henwyn Tyller A-Z". Akademi Kernewek. Retrieved 25 April 2021.
- "E05 Electoral Ward/Division Menheniot E05009211". Office for National Statistics. Retrieved 25 April 2021.
- "E05 Electoral Ward/Division Menheniot E05008250". Office for National Statistics. Retrieved 27 August 2021.
- "Election results for Menheniot Cornwall Council elections - Thursday, 4th May, 2017". Cornwall Council. Retrieved 25 April 2021.
- "Election results for Menheniot Menheniot By-election - Thursday, 14th April, 2016". Cornwall Council. Retrieved 25 April 2021.
- "Election results for Menheniot Cornwall Council elections - Thursday, 2nd May, 2013". Cornwall Council. Retrieved 25 April 2021.
- "Election results for Menheniot Cornwall Council elections - Thursday, 4th June, 2009". Cornwall Council. Retrieved 25 April 2021.