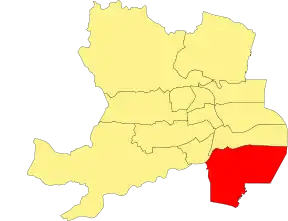
Kincorth/Nigg/Cove (ward)
Kincorth/Nigg/Cove is one of the thirteen wards used to elect members of the Aberdeen City Council. It elects four Councillors.
Location of the ward[1]
Councillors
| Election | Councillors | |||||||
|---|---|---|---|---|---|---|---|---|
| 2017 | Stephen Flynn (SNP) |
Alex Nicoll (SNP) |
Philip Sellar (Conservative) |
Sarah Duncan (Labour) | ||||
| 2020 by-election |
Miranda Radley (SNP) | |||||||
| 2022 | Richard Brooks (Conservative) |
Lynn Thomson (Labour) | ||||||
Election results
2022 election
| Party | Candidate | FPv% | Count | ||||
|---|---|---|---|---|---|---|---|
| 1 | 2 | 3 | 4 | ||||
| SNP | Alex Nicoll (incumbent) | 30.5 | 1,465 | ||||
| Conservative | Richard Brooks | 21.1 | 1,014 | ||||
| Labour | Lynn Thomson | 18.9 | 904 | 917 | 949 | 966 | |
| SNP | Miranda Radley (incumbent) | 15.2 | 731 | 1,171 | |||
| Liberal Democrats | Moira Henderson | 6.5 | 314 | 321 | 335 | 350 | |
| Alba | Charlie Abel | 3.8 | 184 | 191 | 222 | 223 | |
| Scottish Green | Heather Herbert | 3.3 | 156 | 163 | 236 | 237 | |
| Libertarian | Bryce Hope | 0.6 | 29 | 29 | 30 | 31 | |
| Electorate: 13,058 Valid: 4,797 Spoilt: 82 Quota: 960 Turnout: 37.4% | |||||||
2020 by-election
| Party | Candidate | FPv% | Count | ||||||||
|---|---|---|---|---|---|---|---|---|---|---|---|
| 1 | 2 | 3 | 4 | 5 | 6 | 7 | 8 | ||||
| SNP | Miranda Radley | 47.4 | 1,661 | 1,661 | 1,663 | 1,672 | 1,691 | 1,697 | 1,716 | 1,785 | |
| Conservative | Christopher Wyles | 20.2 | 709 | 710 | 712 | 713 | 714 | 725 | 746 | 834 | |
| Labour | Shona Simpson | 12.2 | 429 | 430 | 430 | 431 | 441 | 446 | 471 | 529 | |
| Independent | Andy Finlayson | 10.5 | 367 | 368 | 368 | 374 | 383 | 419 | 451 | ||
| Liberal Democrats | Moira Henderson | 3.6 | 128 | 132 | 132 | 133 | 140 | 148 | |||
| Independent | Simon McLean | 2.5 | 92 | 93 | 97 | 99 | 104 | ||||
| Scottish Green | Daniel Verhamme | 1.7 | 58 | 60 | 61 | 63 | |||||
| Independent | Lizette Belizzi Houston | 0.9 | 31 | 32 | 34 | ||||||
| Independent | Sochima Iroh | 0.5 | 16 | ||||||||
| Libertarian | Bryce Hope | 0.5 | 16 | ||||||||
| Electorate: 13,130 Valid: 3,540 Spoilt: 33 Quota: 1,754 Turnout: 3,573 (27%) | |||||||||||
2017 election
2017 Aberdeen City Council election[4]
| Party | Candidate | FPv% | Count | ||||||||
|---|---|---|---|---|---|---|---|---|---|---|---|
| 1 | 2 | 3 | 4 | 5 | 6 | 7 | 8 | ||||
| SNP | Stephen Flynn | 27.0 | 1,396 | ||||||||
| Conservative | Philip Sellar | 21.5 | 1,113 | ||||||||
| SNP | Alex Nicoll | 13.7 | 707 | 1,020.3 | 1,023.08 | 1,041.9 | |||||
| Labour | Sarah Duncan | 11.4 | 590 | 595.7 | 601.9 | 615.5 | 615.9 | 670.9 | 960.07 | 1,198.6 | |
| Independent | Andy Finlayson | 10.9 | 562 | 571.5 | 585.9 | 719.5 | 720.8 | 812.07 | 845.5 | ||
| Labour | Lynn Thomson | 6.1 | 318 | 322.1 | 329.5 | 343.7 | 344.08 | 388.3 | |||
| Liberal Democrats | Cameron Finnie | 5.2 | 270 | 273.09 | 286.2 | 305.3 | 305.9 | ||||
| Independent | Finlay Crossan | 4.3 | 220 | 224.1 | 232.9 | ||||||
| Electorate: TBC Valid: 5,176 Spoilt: 120 Quota: 1,036 Turnout: 5,296 (40.9%) | |||||||||||
References
- "Scottish Boundary Commission | The Boundary Commission for Scotland is responsible for reviews of UK Parliament constituencies in Scotland". boundaries.scot.
- "Declaration of Results Report Kincorth/Nigg/Cove" (PDF). Aberdeen City Council. 6 May 2022. Retrieved 8 May 2023.
- "Candidate votes per stage Kincorth/Nigg/Cove" (PDF). Aberdeen City Council. 6 May 2022. Retrieved 8 May 2023.
- "Local government election 2017: Results | Aberdeen City Council". www.aberdeencity.gov.uk. 29 June 2021.
This article is issued from Wikipedia. The text is licensed under Creative Commons - Attribution - Sharealike. Additional terms may apply for the media files.
