1986 Japanese House of Councillors election
Elections for the Japanese House of Councillors were held in Japan in 1986.
| |||||||||||||||||||||||||||||||||||||||||||||||||||||||||||||||||||||||||||||
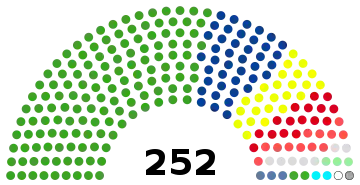
127 of the 252 seats in the House of Councillors 127 seats needed for a majority | |||||||||||||||||||||||||||||||||||||||||||||||||||||||||||||||||||||||||||||
|---|---|---|---|---|---|---|---|---|---|---|---|---|---|---|---|---|---|---|---|---|---|---|---|---|---|---|---|---|---|---|---|---|---|---|---|---|---|---|---|---|---|---|---|---|---|---|---|---|---|---|---|---|---|---|---|---|---|---|---|---|---|---|---|---|---|---|---|---|---|---|---|---|---|---|---|---|---|
| |||||||||||||||||||||||||||||||||||||||||||||||||||||||||||||||||||||||||||||
| |||||||||||||||||||||||||||||||||||||||||||||||||||||||||||||||||||||||||||||
| This article is part of a series on |
| Politics of Japan |
|---|
 |
|
|
|
|
Only half of this House of Councillors was up for election. The results show the whole legislature following the elections.
Results
 | ||||||||||||
|---|---|---|---|---|---|---|---|---|---|---|---|---|
| Party | National | Constituency | Seats | |||||||||
| Votes | % | Seats | Votes | % | Seats | Not up | Won | Total after | +/– | |||
| Liberal Democratic Party | 22,132,573 | 38.58 | 22 | 26,111,258 | 45.07 | 50 | 68 | 72 | 140 | +3 | ||
| Japan Socialist Party | 9,869,088 | 17.20 | 9 | 12,464,579 | 21.51 | 11 | 21 | 20 | 41 | –3 | ||
| Kōmeitō | 7,438,501 | 12.97 | 7 | 2,549,037 | 4.40 | 3 | 14 | 10 | 24 | –2 | ||
| Japanese Communist Party | 5,430,838 | 9.47 | 5 | 6,617,487 | 11.42 | 4 | 7 | 9 | 16 | +2 | ||
| Democratic Socialist Party | 3,940,325 | 6.87 | 3 | 2,643,370 | 4.56 | 2 | 7 | 5 | 12 | +1 | ||
| Tax Affairs Party | 1,803,051 | 3.14 | 1 | 327,444 | 0.57 | 0 | 1 | 1 | 2 | New | ||
| New Party for Salaried Men | 1,759,484 | 3.07 | 1 | 2 | 1 | 3 | +1 | |||||
| Dainiin Club | 1,455,532 | 2.54 | 1 | 2 | 1 | 3 | +1 | |||||
| New Liberal Club | 1,367,291 | 2.38 | 1 | 1 | 1 | 2 | 0 | |||||
| Other parties | 2,166,059 | 3.78 | 0 | 1,192,801 | 2.06 | 0 | 1 | 0 | 1 | – | ||
| Independents | 6,032,259 | 10.41 | 6 | 1 | 6 | 7 | +1 | |||||
| Vacant | 1 | 0 | 1 | 1 | – | |||||||
| Total | 57,362,742 | 100.00 | 50 | 57,938,235 | 100.00 | 77 | 125 | 127 | 252 | 0 | ||
| Valid votes | 57,362,742 | 93.06 | 57,938,235 | 93.94 | ||||||||
| Invalid/blank votes | 4,280,530 | 6.94 | 3,735,135 | 6.06 | ||||||||
| Total votes | 61,643,272 | 100.00 | 61,673,370 | 100.00 | ||||||||
| Registered voters/turnout | 86,426,845 | 71.32 | 86,426,845 | 71.36 | ||||||||
| Source: Ministry of Internal Affairs and Communications,[1][2] National Diet | ||||||||||||
By constituency
| Constituency | Total seats |
Seats won | |||||||||
|---|---|---|---|---|---|---|---|---|---|---|---|
| LDP | JSP | Kōmeitō | JCP | DSP | TAP | NPSM | DC | NLC | Ind. | ||
| Aichi | 3 | 1 | 1 | 1 | |||||||
| Akita | 1 | 1 | |||||||||
| Aomori | 1 | 1 | |||||||||
| Chiba | 2 | 1 | 1 | ||||||||
| Ehime | 1 | 1 | |||||||||
| Fukui | 1 | 1 | |||||||||
| Fukuoka | 3 | 2 | 1 | ||||||||
| Fukushima | 2 | 1 | 1 | ||||||||
| Gifu | 1 | 1 | |||||||||
| Gunma | 2 | 2 | |||||||||
| Hiroshima | 2 | 1 | 1 | ||||||||
| Hokkaido | 4 | 2 | 1 | 1 | |||||||
| Hyōgo | 3 | 1 | 1 | 1 | |||||||
| Ibaraki | 2 | 1 | 1 | ||||||||
| Ishikawa | 1 | 1 | |||||||||
| Iwate | 1 | 1 | |||||||||
| Kagawa | 1 | 1 | |||||||||
| Kagoshima | 2 | 2 | |||||||||
| Kanagawa | 2 | 1 | 1 | ||||||||
| Kōchi | 1 | 1 | |||||||||
| Kumamoto | 2 | 2 | |||||||||
| Kyoto | 2 | 1 | 1 | ||||||||
| Mie | 1 | 1 | |||||||||
| Miyagi | 1 | 1 | |||||||||
| Miyazaki | 1 | 1 | |||||||||
| Nagano | 2 | 1 | 1 | ||||||||
| Nagasaki | 1 | 1 | |||||||||
| Nara | 1 | 1 | |||||||||
| Niigata | 2 | 1 | 1 | ||||||||
| Ōita | 1 | 1 | |||||||||
| Okinawa | 1 | 1 | |||||||||
| Okayama | 2 | 1 | 1 | ||||||||
| Osaka | 3 | 1 | 1 | 1 | |||||||
| Saga | 1 | 1 | |||||||||
| Saitama | 2 | 1 | 1 | ||||||||
| Shiga | 1 | 1 | |||||||||
| Shimane | 1 | 1 | |||||||||
| Shizuoka | 2 | 1 | 1 | ||||||||
| Tochigi | 2 | 2 | |||||||||
| Tokushima | 1 | 1 | |||||||||
| Tokyo | 4 | 2 | 1 | 1 | |||||||
| Tottori | 1 | 1 | |||||||||
| Toyama | 1 | 1 | |||||||||
| Wakayama | 1 | 1 | |||||||||
| Yamagata | 1 | 1 | |||||||||
| Yamaguchi | 1 | 1 | |||||||||
| Yamanashi | 1 | 1 | |||||||||
| National | 50 | 22 | 9 | 7 | 5 | 3 | 1 | 1 | 1 | 1 | |
| Total | 126 | 72 | 20 | 10 | 9 | 5 | 1 | 1 | 1 | 1 | 6 |
References
- Table 13: Persons Elected and Votes Polled by Political Parties - Ordinary Elections for the House of Councillors (1947–2004) Archived 2011-03-23 at the Wayback Machine Ministry of Internal Affairs and Communications
- "27-11 Allotted Number, Candidates, Eligible Voters as of Election Day, Voters and Voting Percentages of Ordinary Elections for the House of Councillors (1947-2004)". Ministry of Internal Affairs and Communications. Archived from the original on 2006-01-04.
| General elections | |
|---|---|
| Councillors elections | |
| Unified local elections | |
| Supreme Court retention elections |
|
| |
This article is issued from Wikipedia. The text is licensed under Creative Commons - Attribution - Sharealike. Additional terms may apply for the media files.