Islington South West (UK Parliament constituency)
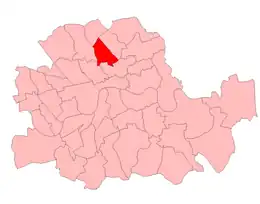
Islington South West was a Parliamentary constituency in the Metropolitan Borough of Islington, in North London.
| Islington South West | |
|---|---|
| Former Borough constituency for the House of Commons | |
 Islington South West boundaries from 1950-74 | |
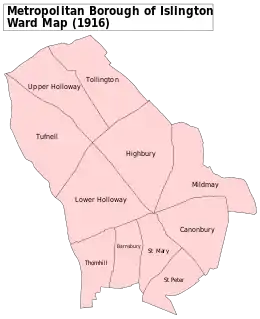
 Islington Metropolitan Borough in 1916 | |
| 1950–February 1974 | |
| Seats | one |
| Created from | Islington South and Islington West |
| Replaced by | Islington Central and Islington South and Finsbury |
It returned one Member of Parliament (MP) to the House of Commons of the Parliament of the United Kingdom from 1950 until it was abolished for the February 1974 general election.
Boundaries
The Metropolitan Borough of Islington wards of Barnsbury, Lower Holloway, St Mary, St Peter, and Thornhill.[1]
Members of Parliament
| Election | Member | Party | |
|---|---|---|---|
| 1950 | Albert Evans | Labour | |
| 1970 | George Cunningham | Labour | |
| Feb 1974 | constituency abolished: see Islington South & Finsbury | ||
Election results
Elections in the 1950s
| Party | Candidate | Votes | % | ±% | |
|---|---|---|---|---|---|
| Labour | Albert Evans | 30,201 | 64.74 | ||
| Conservative | Tom Howard | 13,012 | 27.89 | ||
| Liberal | George William Waddilove | 2,602 | 5.58 | ||
| Communist | Alfred Bender | 834 | 1.79 | ||
| Majority | 17,189 | 36.85 | |||
| Turnout | 46,649 | 74.60 | |||
| Labour win (new seat) | |||||
| Party | Candidate | Votes | % | ±% | |
|---|---|---|---|---|---|
| Labour | Albert Evans | 31,637 | 68.20 | ||
| Conservative | Tom Howard | 14,750 | 31.80 | ||
| Majority | 16,887 | 36.40 | |||
| Turnout | 46,387 | 75.17 | |||
| Labour hold | Swing | ||||
| Party | Candidate | Votes | % | ±% | |
|---|---|---|---|---|---|
| Labour | Albert Evans | 24,935 | 68.12 | ||
| Conservative | Colin GS Hodgkinson | 11,667 | 31.88 | ||
| Majority | 13,268 | 36.24 | |||
| Turnout | 36,602 | 62.04 | |||
| Labour hold | Swing | ||||
| Party | Candidate | Votes | % | ±% | |
|---|---|---|---|---|---|
| Labour | Albert Evans | 22,362 | 65.13 | ||
| Conservative | Nicholas Scott | 11,974 | 34.87 | ||
| Majority | 10,388 | 30.26 | |||
| Turnout | 34,336 | 60.64 | |||
| Labour hold | Swing | ||||
Elections in the 1960s
| Party | Candidate | Votes | % | ±% | |
|---|---|---|---|---|---|
| Labour | Albert Evans | 17,589 | 65.17 | +0.04 | |
| Conservative | Nicholas Scott | 8,023 | 29.73 | -5.14 | |
| Communist | John F Moss | 1,377 | 5.10 | New | |
| Majority | 9,566 | 35.44 | +5.18 | ||
| Turnout | 26,989 | 51.53 | -9.11 | ||
| Registered electors | 52,373 | ||||
| Labour hold | Swing | +2.59 | |||
| Party | Candidate | Votes | % | ±% | |
|---|---|---|---|---|---|
| Labour | Albert Evans | 16,206 | 64.95 | -0.22 | |
| Conservative | Alan Hardy | 5,903 | 23.66 | -6.07 | |
| Independent | Harry Weston | 1,271 | 5.09 | New | |
| Union Movement | Dennis Herbert Harmston | 816 | 3.27 | New | |
| Communist | John F Moss | 756 | 3.03 | -2.07 | |
| Majority | 10,303 | 41.29 | +5.85 | ||
| Turnout | 24,952 | 50.93 | -0.60 | ||
| Registered electors | 48,995 | ||||
| Labour hold | Swing | +2.93 | |||
Election in the 1970s
| Party | Candidate | Votes | % | ±% | |
|---|---|---|---|---|---|
| Labour | George Cunningham | 12,876 | 60.89 | ||
| Conservative | John Szemerey | 6,601 | 31.21 | ||
| New Liberal | Alan Ernest Lomas | 1,161 | 5.49 | New | |
| Communist | Marie Betteridge | 509 | 2.41 | ||
| Majority | 6,275 | 29.68 | |||
| Turnout | 21,147 | 48.84 | |||
| Labour hold | Swing | ||||
References
- Craig, F.W.S., ed. (1972). Boundaries of parliamentary constituencies 1985-1972. Chichester, Sussex: Political Reference Publications. ISBN 0-900178-09-4.
- British parliamentary election results, 1950-1973 by FWS Craig
- Kimber, Richard. "UK General Election results 1964". Political Science Resources. Retrieved 15 April 2016.
- Kimber, Richard. "UK General Election results 1966". Political Science Resources. Retrieved 15 April 2016.
This article is issued from Wikipedia. The text is licensed under Creative Commons - Attribution - Sharealike. Additional terms may apply for the media files.