Wind power by country
The worldwide total cumulative installed electricity generation capacity from wind power has increased rapidly since the start of the third millennium, and as of the end of 2020, it amounts to 733 GW. Since 2010, more than half of all new wind power was added outside the traditional markets of Europe and North America, mainly driven by the continuing boom in China and India. At the end of 2015, China had 145 GW of wind power installed.[3] In 2015, China installed close to half the world's added wind power capacity.[4]


Wind power is used on a commercial basis in more than half of all the countries of the world.[5]
By 2020, 56% wind power penetration was achieved in Denmark, 40% in Uruguay, 36% in Lithuania, 35% in Ireland, 24% in the UK, 23% in Portugal and in Germany, 20% in Spain, 18% in Greece, 16% in Sweden, 15% (avg) in the EU, 8% in the US, and 6% in China.[6]
In November 2018, wind power generation in Scotland was higher than the country's electricity consumption during the month.[7] Wind power's share of worldwide electricity usage at the end of 2018 was 4.8%,[4] up from 3.1% four years earlier.[8] In Europe, its share of power generation capacity was 18.8% in 2018.[5] In 2018, upcoming wind power markets rose from 8% to 10% across the Middle East, Latin America, South East Asia, and Africa.[9]
Installed capacity
This section provides end-of-year figures of worldwide installed wind power capacity by country, including both onshore and offshore. The data is sourced from Global Wind Energy Council.[10] In 2018, global wind power capacity increased by 51 GW to 591 GW, an increase of 9.6% compared to the end of 2017.[11]
Top 10 countries by added wind capacity in 2021[12] |
Top 10 countries by cumulative wind capacity in 2021[13] |
Number of countries with wind
capacities in the gigawatt-scale
2021 


2019 
2018 


2017 
2016 


2015 

2012 

2011 
.svg.png.webp)
2010 


2009 
2008 
.svg.png.webp)

2006 .svg.png.webp)

2005 


2004 

1999 

1997 
1995 
1986 
2021 

2018 
2016 
2015 .svg.png.webp)

2013 
2009 
2008 
2006 

2002 
2019 
2014 
List by country: recent
| # | Country or territory | 2014[14] | 2015[3] | 2016[15] | 2017[16] | 2018[17] | 2019[13] | 2020[18] | 2021[19] | 2022[20] | Per capita (watts) (2020) |
Share of total consumption |
|---|---|---|---|---|---|---|---|---|---|---|---|---|
| 1 | 114,763 | 145,104 | 168,690 | 188,232 | 211,392 | 236,320 | 281,993 | 328,973 | 365,964 | 200 | 6.1% (2020) | |
| – | 128,752 | 141,579 | 153,730 | 169,319 | 178,826 | 192,020 | 201,507 | 187,497* | 202,700* | |||
| 2 | 65,879 | 74,472 | 82,183 | 89,077 | 96,665 | 105,466 | 117,744 | 132,738 | 140,862 | 355 | 9.2% (2021) | |
| 3 | 39,165 | 44,947 | 50,019 | 56,132 | 59,311 | 61,357 | 62,184 | 63,760 | 66,315 | 747 | 23.1% (2021) | |
| 4 | 22,465 | 27,151 | 28,665 | 32,848 | 35,129 | 37,506 | 38,559 | 40,067 | 41,930 | 28 | ||
| 5 | 22,987 | 23,025 | 23,075 | 23,170 | 23,494 | 25,808 | 27,089 | 27,497 | 29,308 | 572 | 19% (2015) | |
| 6 | 12,440 | 13,603 | 15,030 | 18,872 | 20,970 | 23,515 | 24,665 | 27,130 | 28,537 | 369 | 21% (2021) | |
| 7 | 5,939 | 8,715 | 10,740 | 12,763 | 14,707 | 15,452 | 17,198 | 21,161 | 24,163 | 81 | ||
| 8 | 9,285 | 10,358 | 12,065 | 13,759 | 15,309 | 16,643 | 17,382 | 18,676 | 21,120 | 258 | 4.3% (2015) | |
| 9 | 9,694 | 11,205 | 11,898 | 12,239 | 12,816 | 13,413 | 13,577 | 14,304 | 15,295 | 353 | ||
| 10 | 5,425 | 6,025 | 6,519 | 6,691 | 7,407 | 8,804 | 9,688 | 12,080 | 14,557 | 933 | 20.3% (2020) | |
| 11 | 8,663 | 8,958 | 9,257 | 9,479 | 9,958 | 10,512 | 10,839 | 11,276 | 11,780 | 183 | 7.1% (2019) | |
| 12 | 3,763 | 4,718 | 6,101 | 6,516 | 7,369 | 8,056 | 8,832 | 10,607 | 11,396 | 106 | ||
| 13 | 3,806 | 4,187 | 4,327 | 4,557 | 5,362 | 6,199 | 8,603 | 8,951 | 10,134 | 367 | ||
| 14 | 2,805 | 3,431 | 4,328 | 4,341 | 4,471 | 4,600 | 6,600 | 7,801 | 8,688 | 375 | ||
| 15 | 3,834 | 5,100 | 5,782 | 6,397 | 5,864 | 5,917 | 6,267 | 6,958 | 7,987 | 164 | ||
| 16 | 2,551 | 3,073 | 3,527 | 4,005 | 4,935 | 6,215 | 6,504 | 7,154 | 7,312 | 65 | ||
| 17 | 4,845 | 5,063 | 5,227 | 5,476 | 5,758 | 6,128 | 6,235 | 7,014 | 7,088 | 1068 | 55% (2022)[25] | |
| 18 | 627 | 1,005 | 1,539 | 2,113 | 2,041 | 2,284 | 2,474 | 3,257 | 5,614 | 449 | 14.1% (2022)[26] | |
| 19 | 4,914 | 5,079 | 5,316 | 5,316 | 5,380 | 5,437 | 5,239 | 5,248 | 5,455 | 509 | ||
| 20 | 1,959 | 2,229 | 2,386 | 2,843 | 3,360 | 3,879 | 4,692 | 4,780 | 5,251 | 406 | ||
| 21 | 819 | 838 | 838 | 1,162 | 1,675 | 2,444 | 3,977 | 4,650 | 5,134 | 738 | 11% (2022)[30] | |
| 22 | 1,980 | 2,152 | 2,374 | 2,651 | 2,844 | 3,576 | 4,113 | 4,457 | 4,879 | 384 | ||
| 23 | – | 135 | 151 | 197 | 228 | 388 | 600 | 4,118 | 4,628 | |||
| 24 | 2,272 | 2,486 | 2,830 | 3,127 | 3,564 | 4,155 | 4,300 | 4,332 | 4,619 | 864 | 34% (2022)[31] | |
| 25 | 2,789 | 3,038 | 3,234 | 3,400 | 3,661 | 3,923 | 4,206 | 4,471 | 4,577 | 34 | ||
| 26 | 836 | 933 | 1,424 | 1,540 | 1,621 | 2,150 | 2,149 | 3,137 | 3,830 | 109 | ||
| 27 | 2,095 | 2,412 | 2,632 | 2,828 | 3,045 | 3,159 | 3,224 | 3,524 | 3,736 | 361 | ||
| 28 | 204 | 204 | 204 | 228 | 722 | 1,604 | 2,624 | 3,292 | 3,309 | 57 | 10.2% (2022)[32] | |
| 29 | 570 | 1,053 | 1,471 | 2,094 | 2,085 | 2,085 | 2,636 | 2,956 | 3,103 | 44 | ||
| 30 | 2,953 | 2,976 | 3,028 | 3,029 | 3,029 | 3,029 | 3,013 | 3,013 | 3,015 | 156 | ||
| 31 | – | 17 | 17 | 17 | 141 | 191 | 945 | 1,955 | 2,218 | 6 | ||
| 32 | 609 | 852 | 1,089 | 1,136 | 1,302 | 1,420 | 1,636 | 1,708 | 1,893 | 32 | ||
| 33 | 498 | 514 | 526 | 593 | 533 | 1,170 | 1,402 | 1,761 | 1,761 | 34 | ||
| 34 | 610 | 610 | 810 | 810 | 1,190 | 1,375 | 1,375 | 1,640 | 1,643 | 14 | ||
| 35 | – | 647 | 682 | 692 | 702 | 712 | 854 | 1,033 | 1,581 | 36 | ||
| 36 | 787 | 787 | 787 | 787 | 1,207 | 1,207 | 1,405 | 1,435 | 1,556 | 39 | ||
| 37 | 223 | 223 | 430 | 648 | 778 | 1,507 | 1,507 | 1,545 | 1,545 | 23 | ||
| 38 | 701 | 845 | 1,210 | 1,505 | 1,514 | 1,514 | 1,514 | 1,514 | 1,514 | 426 | ||
| 39 | – | 255 | 591 | 792 | 1,189 | 1,236 | 1,236 | 1,335 | 1,435 | 5 | ||
| 40 | 53 | 72 | 98 | 112 | 121 | 284 | 486 | 684 | 1,108 | 26 | ||
| 41 | 347 | 387 | 422 | 613 | 613 | 652 | 788 | 988 | 1,043 | 195 | ||
| 42 | 623 | 623 | 623 | 623 | 689 | 690 | 784 | 912 | 912 | 153 | ||
| 43 | 279 | 315 | 493 | 493 | 439 | 533 | 539 | 671 | 814 | 193 | ||
| 44 | 691 | 691 | 691 | 691 | 691 | 691 | 703 | 704 | 704 | 102 | ||
| 45 | – | 119 | 198 | 198 | 280 | 370 | 515 | 622 | 622 | 47 | ||
| 46 | 18 | 18 | 18 | 18 | 18 | 18 | 510 | ? | ? | 10 | ||
| 47 | 216 | 216 | 427 | 427 | 427 | 427 | 443 | 443 | 443 | 4 | ||
| 48 | – | 26 | 26 | 26 | 336 | 336 | 336 | 436 | 436 | 7 | ||
| 49 | – | 85 | 135 | 135 | 193 | 370 | 370 | 370 | 417 | 35 | ||
| 50 | 148 | 148 | 243 | 243 | 375 | 375 | 376 | 409 | 409 | 11 | ||
| 51 | 171 | 324 | 324 | 324 | 324 | 324 | 324 | 324 | 404 | 3 | ||
| 52 | – | 10 | 10 | 18 | 374 | 374 | 397 | 398 | 398 | 57 | ||
| 53 | 198 | 268 | 319 | 378 | 408 | 459 | 394 | 394 | 394 | 76 | ||
| 54 | n.a. | 129 | 134 | 191 | 282 | 303 | 303 | 310 | 342 | 4 | ||
| 55 | 215 | 281 | 282 | 308 | 316 | 339 | 339 | 339 | 339 | 32 | ||
| 56 | 329 | 329 | 329 | 329 | 329 | 323 | 323 | 324 | 324 | 33 | ||
| 57 | 302 | 303 | 310 | 310 | 310 | 316 | 315 | 315 | 315 | 238 | ||
| 58 | 35 | 270 | 270 | 270 | 270 | 270 | 270 | 270 | 270 | 63 | ||
| 59 | 121 | 131 | 131 | 131 | 128 | 128 | 252 | 252 | 252 | 11 | ||
| 60 | 245 | 245 | 358 | 244 | 244 | 244 | 244 | 245 | 245 | 21 | ||
| 61 | 126 | 176 | 180 | 225 | 274 | 239 | 239 | 239 | 239 | 26 | ||
| 62 | 186 | 186 | 186 | 186 | 186 | 186 | 186 | 186 | 186 | 28 | ||
| 63 | 58 | 58 | 100 | 120 | 120 | 136 | 136 | 136 | 165 | 262 | ||
| 64 | - | - | - | - | - | 55 | 159 | 159 | 159 | |||
| 65 | 147 | 158 | 158 | 158 | 158 | 158 | 158 | 158 | 158 | 178 | ||
| 66 | 50 | 50 | 50 | 100 | 149 | 149 | 156 | 156 | 156 | 46 | ||
| 67 | 1 | 1 | 1 | 1 | 144 | 154 | 154 | 154 | 154 | 1 | ||
| 68 | 1 | 1 | 1 | 34 | 34 | 34 | 139 | 139 | 139 | |||
| 69 | 69 | 68 | 70 | 77 | 78 | 78 | 77 | 77 | 136 | |||
| 70 | - | - | - | - | 51 | 87 | 135 | 135 | 135 | |||
| 71 | 3 | 3 | 27 | 27 | 27 | 27 | 27 | 128 | 131 | |||
| 72 | - | - | - | 72 | 72 | 118 | 118 | 118 | 118 | |||
| 73 | 9 | 22 | 62 | 84 | 92 | 112 | 112 | 112 | 112 | |||
| 74 | - | 76 | 76 | 76 | 107 | 107 | 107 | 107 | 107 | |||
| 75 | 1 | 1 | 2 | 9 | 33 | 35 | 73 | 73 | 102 | |||
| 76 | 125 | 125 | 125 | 99 | 99 | 99 | 99 | 99 | 99 | |||
| 77 | 39 | 39 | 99 | 99 | 99 | 99 | 99 | 99 | 99 | |||
| – | Rest of Caribbean | 250 | 250 | 200 | 218 | n.a. | - | |||||
| – | Pacific Islands | 12 | 12 | 13 | 13 | 13 | 13 | 54 | ||||
| – | Rest of Europe | 5,715 | 6,543 | - | ||||||||
| – | Rest of Latin America & Caribbean | 250 | 285 | - | ||||||||
| – | Rest of Africa & Middle East | 129 | 151 | 159 | 159 | - | ||||||
| – | Rest of Asia | – | 167 | 70 | 70 | n.a. | - | |||||
| World total | 369,553 | 432,419 | 487,657 | 539,581 | 591,549 | 650,758 | 733,276 | 824,874 | 898,824 | |||
| *From 2021, data about the European Union refers to the EU27 without the United Kingdom | ||||||||||||
List by country: earlier (2004-2013)
| Rank | Country | 2004 | 2005[35] | 2006[35] | 2007[35] | 2008[35] | 2009[36] | 2010[37] | 2011[38] | 2012[39] | 2013[40] |
|---|---|---|---|---|---|---|---|---|---|---|---|
| 1 | 764 | 1,266 | 2,599 | 5,912 | 12,210 | 25,777 | 44,733 | 62,364 | 75,324 | 91,324 | |
| 2 | 6,725 | 9,149 | 11,603 | 16,818 | 25,170 | 35,159 | 40,180 | 46,919 | 59,882 | 61,108 | |
| 3 | 16,628 | 18,427 | 20,622 | 22,247 | 23,902 | 25,777 | 27,215 | 29,075 | 31,038 | 34,660 | |
| 4 | 8,263 | 10,027 | 11,630 | 15,145 | 16,740 | 19,149 | 20,676 | 21,673 | 22,796 | 22,959 | |
| 5 | 3,000 | 4,430 | 6,270 | 7,850 | 9,587 | 10,925 | 13,065 | 15,880 | 18,321 | 20,150 | |
| 6 | 888 | 1,353 | 1,962 | 2,389 | 3,287 | 4,092 | 5,204 | 6,018 | 8,445 | 10,531 | |
| 7 | 1,265 | 1,718 | 2,123 | 2,726 | 3,736 | 4,850 | 5,797 | 6,737 | 8,144 | 8,551 | |
| 8 | 386 | 757 | 1,567 | 2,455 | 3,404 | 4,521 | 5,660 | 6,640 | 7,473 | 8,254 | |
| 9 | 444 | 683 | 1,460 | 1,846 | 2,369 | 3,319 | 4,008 | 5,265 | 6,201 | 7,698 | |
| 10 | 3,124 | 3,128 | 3,136 | 3,125 | 3,160.0 | 3,497 | 3,734 | 3,927 | 4,162 | 4,772 | |
| 11 | 522 | 1,022 | 1,716 | 2,130 | 2,862 | 3,535 | 3,702 | 4,083 | 4,525 | 4,724 | |
| 12 | 452 | 509.1 | 571.2 | 831.0 | 1066 | 1,579 | 2,052 | 2,798 | 3,745 | 4,470 | |
| 13 | 23.8 | 28.6 | 236.9 | 247.1 | 338.5 | 606 | 920 | 1,429 | 2,507 | 3,399 | |
| 14 | 58.2 | 73 | 153 | 276 | 544 | 725 | 1,107 | 1,616.4 | 2,497 | 3,390 | |
| 15 | 379 | 579 | 817.3 | 817.3 | 1,494.0 | 1,877 | 1,880 | 2,005 | 2,584 | 3,049 | |
| 16 | 20.6 | 20.1 | 64.6 | 206.8 | 333.4 | 796.5 | 1,274 | 1,799 | 2,312 | 2,959 | |
| 17 | 1,078 | 1,224 | 1,559 | 1,747 | 2,225.0 | 2,229 | 2,237 | 2,328 | 2,391 | 2,693 | |
| 18 | 896.2 | 1,040 | 1,309 | 1,528 | 1,880.0 | 2,056 | 2,304 | 2,501 | 2,614 | 2,661 | |
| 19 | 0 | 0.9 | 2.8 | 7.8 | 7.0 | 14.0 | 591 | 826 | 1,905 | 2,599 | |
| 20 | 338.9 | 495.2 | 746 | 805 | 1,244.7 | 1,260 | 1,428 | 1,614 | 1,738 | 2,037 | |
| 21 | 2.2 | 2.2 | 84 | 85.0 | 85.0 | 402 | 521 | 929 | 1,348 | 1,992 | |
| 22 | 473 | 573.3 | 757.6 | 873.3 | 989.7 | 1,109 | 1,208 | 1,626.5 | 1,749 | 1,865 | |
| 23 | 606 | 819 | 964.5 | 981.5 | 994.9 | 995 | 1,011 | 1,084 | 1,378 | 1,684 | |
| 24 | 95 | 167.4 | 194.3 | 286.9 | 383.6 | 555 | 886 | 1,078 | 1,375 | 1,651 | |
| 25 | 270 | 268 | 325 | 333.0 | 428.0 | 431 | 434 | 520.0 | 703.0 | 768 | |
| 26 | 10 | 14 | 36 | 57 | 120 | 177 | 375 | 503.0 | 684.0 | 681 | |
| 27 | 168.1 | 168.2 | 171 | 321.8 | 325.3 | 497 | 506 | 622.8 | 622.8 | 623 | |
| 28 | 13 | 103.7 | 187.7 | 279.9 | 358.2 | 436 | 519 | 563.8 | 563.8 | 614 | |
| 29 | 22.5 | 119.1 | 176.3 | 192.1 | 278.0 | 364.4 | 379 | 406.3 | 482.6 | 561 | |
| 30 | 145 | 145 | 230 | 310 | 390.0 | 430 | 550 | 550.0 | 550.0 | 550 | |
| 31 | 53.9 | 64 | 64 | 125.2 | 125.2 | 253 | 286 | 291.0 | 291.0 | 494.8 | |
| 32 | 82 | 82 | 86 | 110 | 140.0 | 147 | 197 | 197.0 | 288.0 | 448.0 | |
| 33 | 68.8 | 77.3 | 85.6 | 89.0 | 90.0 | 90 | 87.4 | 151.1 | 276.0 | 371.0 | |
| 34 | 2 | 2 | 2 | 20.1 | 20.1 | 78 | 170 | 190.0 | 190.0 | 335.0 | |
| 35 | 3.5 | 17.5 | 60.9 | 65.0 | 127.0 | 201 | 295 | 329.4 | 329.4 | 329.4 | |
| 36 | 6 | 6 | 17.2 | 17.2 | 18.2 | 27.8 | 69.8 | 131.0 | 180.0 | 302.0 | |
| 37 | 22.1 | 33 | 33 | 58.6 | 78.3 | 142.3 | 149 | 184.0 | 269.0 | 280.0 | |
| 38 | 7 | 7 | 55.0 | 52.3 | 54.4 | 91 | 154 | 179.0 | 225.0 | 279.0 | |
| 39 | 16.5 | 29.5 | 56.5 | 116 | 150.0 | 191 | 215 | 217.0 | 260.0 | 269.0 | |
| 40 | 25.6 | 26.8 | 27.8 | 29.8 | 29.8 | 29.8 | 54.0 | 129.2 | 233.2 | 217.1 | |
| 41 | 193.0 | ||||||||||
| 42 | 30.0 | 30.0 | 51.0 | 171.0 | |||||||
| 43 | 69.9 | 71 | 74 | 74 | 74.0 | 123 | 123 | 148.2 | 148.2 | 148.2 | |
| 44 | 0 | 0 | 0 | 0 | 0 | 0 | 82.0 | 134.0 | 147.0 | 147.0 | |
| 45 | 0 | 0 | 0 | 0 | 0 | 40 | 40.0 | 63.0 | 102.0 | 141.6 | |
| 46 | Puerto Rico | 0 | 125.0 | 125.0 | |||||||
| 47 | 0 | 0 | 0 | 0 | 6.0 | 6.0 | 6.0 | 6.0 | 106.0 | 106.0 | |
| 48 | 20 | 20 | 20 | 20 | 20.0 | 20.0 | 54.0 | 54.0 | 104.0 | 104.0 | |
| 49 | 16.55 | 16.6 | 16.6 | 16.6 | 21.8 | 21.8 | 10.0 | 10.1 | 10.1 | 102.0 | |
| 50 | 0.0 | 70.0 | 70.0 | 102.0 | |||||||
| 51 | 25 | 31.6 | 47.4 | 66.5 | 82.0 | 82 | 100 | 100.0 | 100.0 | 100.0 | |
| 52 | 26.7 | 22.9 | 26.9 | 26.9 | 26.9 | 28.5 | 31.0 | 31.0 | 68.0 | 68.0 | |
| 53 | 8.7 | 11.6 | 11.6 | 11.6 | 13.8 | 17.6 | 42.0 | 45.5 | 50.0 | 60.0 | |
| 54 | 0.15 | 0.2 | 0.2 | 0.6 | 20.5 | 20.5 | 30.5 | 40.5 | 52.0 | 59.3 | |
| 55 | 35.3 | 35.3 | 35.3 | 35.3 | 35.3 | 35.3 | 42.0 | 44.0 | 45.0 | 58.0 | |
| 56 | 0 | 0 | 0 | 0 | 2.4 | 2.4 | 1.3 | 1.3 | 1.3 | 50.9 | |
| 57 | 20.7 | 20.7 | 20.7 | 20.7 | 20.7 | 29.7 | 29.7 | 47.7 | 47.7 | 47.7 | |
| 58 | 0.0 | 38.2 | 38.2 | 38.2 | |||||||
| 59 | 0 | 0.2 | 0.2 | 0.2 | 33.6 | 33.6 | 33.6 | ||||
| 60 | 25.2 | 25.2 | 25.2 | 25.2 | 25.2 | 33.0 | 33 | 33.0 | 33.0 | 33.0 | |
| 61 | 0 | 0 | 0 | 0 | 1.3 | 8.8 | 30.5 | 31.0 | 31.0 | 31.0 | |
| 62-63 | 0.0 | 30.0 | 30.0 | ||||||||
| 62-63 | 0.0 | 30.0 | 30.0 | 30.0 | |||||||
| 64 | 20.5 | 20.5 | 20.5 | 20.5 | 20.5 | 20.5 | 20.5 | 26.8 | 26.8 | 26.8 | |
| 65 | 2.78 | 2.8 | 2.8 | 2.8 | 2.8 | 2.8 | 25.5 | 38.3 | 24.0 | 25.5 | |
| 66 | 23.4 | ||||||||||
| 67 | 19.5 | 19.5 | 19.5 | 19.5 | 19.5 | 20.0 | 20.0 | 19.5 | 19.5 | 19.5 | |
| 68 | 0 | 0 | 0 | 3.1 | 4.0 | 2.5 | 2.5 | 2.5 | 19.0 | 19.0 | |
| 69 | 10.8 | 14 | 15.5 | 16.5 | 16.5 | 16.5 | 15.4 | 15.4 | 16.8 | 16.8 | |
| 70 | 10.2 | 13.5 | 13.5 | 13.5 | 13.5 | 13.5 | 13.5 | 13.5 | 13.5 | 13.5 | |
| 71 | 0.0 | 12.0 | 12.0 | 12.0 | |||||||
| 72 | 0.45 | 0.5 | 0.5 | 2.1 | 7.2 | 7.2 | 11.7 | 11.7 | 11.7 | 11.7 | |
| 73 | 0.0 | 10.8 | 10.8 | 10.8 | |||||||
| 74 | 0 | 0.1 | 10.1 | ||||||||
| 75 | 0.0 | 10.0 | 10.0 | 10.0 | |||||||
| 76 | 0.2 | 7.2 | 7.2 | 7.2 | |||||||
| 77 | 7 | 7.0 | 7.0 | 6.0 | 6.0 | 6.0 | 6.0 | 6.0 | 6.0 | 6.0 | |
| 78 | 0.15 | 4.1 | 4.1 | 4.1 | 4.1 | 4.1 | 4.0 | 4.0 | 4.0 | 4.0 | |
| 79-80 | 5 | 5 | 5 | 5 | 6.0 | 6.0 | 6.0 | 3.0 | 3.0 | 3.0 | |
| 79-80 | 0.0 | 3.0 | 3.0 | 3.0 | |||||||
| 81-82 | 2.2 | 2.2 | 2.2 | 2.2 | 2.2 | 2.2 | 2.2 | 2.2 | 2.2 | 2.2 | |
| 81-82 | 0.0 | 2.2 | 2.2 | 2.2 | |||||||
| 83-84 | 0 | 0.5 | 0.5 | 0.5 | 0.5 | 0.5 | 1.5 | 2.2 | 2.0 | 2.0 | |
| 83-84 | 0.0 | 2.2 | 2.0 | 2.0 | |||||||
| 85 | 1.1 | 1.1 | 1.1 | 1.1 | 1.1 | 1.9 | 1.9 | 3.5 | 1.9 | 1.9 | |
| 86 | 0.0 | 1.8 | 1.8 | ||||||||
| 87 | 0 | 0.6 | 1.6 | 1.6 | 1.6 | 1.6 | 1.6 | ||||
| 88 | 1.45 | 1.5 | 1.5 | 1.5 | 1.5 | 1.5 | 1.5 | 1.5 | 1.5 | 1.5 | |
| 89 | 0 | 0.8 | 0.8 | 1.0 | 1.2 | 1.4 | 1.4 | 1.4 | 1.4 | 1.4 | |
| 90 | 1.2 | 1.2 | 1.2 | 1.2 | |||||||
| 91-92 | 1.1 | 1.1 | 1.1 | 1.1 | 1.1 | 1.1 | 1.1 | 1.1 | 1.1 | ||
| 91-92 | 0.0 | 1.1 | 1.1 | 1.1 | |||||||
| 93 | 0 | 0 | 1.0 | 1.0 | 1.0 | 1.0 | 1.0 | 1.0 | 1.0 | 1.0 | |
| 0 | 0 | 17.2 | 17.2 | 18.2 | 24.3 | 24.3 | |||||
| 0.0 | 2.6 | ||||||||||
| World | 47,693 | 59,024.1 | 74,122.8 | 93,930.4 | 120,902.9 | 159,213.3 | 196,630 | 237,022 | 282,482 | 318,530 |
Electricity generation
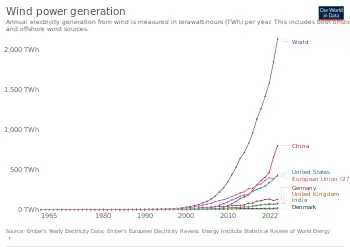
| Country | Wind-power production (TWh) | Average power (MW) |
|---|---|---|
| China | 656 | 74,835 |
| United States | 384 | 43,806 |
| Germany | 118 | 13,461 |
| Brazil | 72.3 | 8,248 |
| India | 68.1 | 7,769 |
| United Kingdom | 64.5 | 7,358 |
| Spain | 62.4 | 7,118 |
| France | 37.0 | 4,221 |
| Canada | 35.1 | 4,004 |
| Turkey | 31.1 | 3,548 |
See also
References
- "Share of electricity production from wind". Our World in Data. Retrieved 15 August 2023.
- "Global Wind Atlas". Technical University of Denmark (DTU). Archived from the original on 18 January 2019. Retrieved 23 November 2021.
- "Global Wind Report 2015" (PDF). report. GWEC. 22 April 2016. Retrieved 23 May 2016.
- "Renewable energy". BP. Archived from the original on 1 December 2019. Retrieved 15 January 2020.
- "Countries - Online Access - The wind power - Wind energy market intelligence". The Wind Power. Retrieved 13 January 2020.
- "Share of electricity production from wind, 2020". Ourworldindata.org. Retrieved 27 December 2020.
- "'Historic' month as wind power meets 109% of energy demands". STV. Retrieved 18 December 2018.
- "Renewables 2015 - Global Status Report" (PDF). p. 31. Archived from the original (PDF) on 26 April 2019. Retrieved 6 October 2023.
- "The wind energy capacity in 2018".
- "Global Wind Report 2018". Global Wind Energy Council. Retrieved 20 January 2020.
- "51.3 GW of global wind capacity installed in 2018". Global Wind Energy Council. Retrieved 20 January 2020.
- "Global wind statistics" (PDF). IRENA. 22 April 2022. Retrieved 22 April 2022.
- "Global wind statistics" (PDF). IRENA. 22 April 2022. Retrieved 22 April 2022.
- "GWEC Global Wind Statistics 2014" (PDF). report. GWEC. 10 February 2015.
- "AWEA 2016 Fourth Quarter Market Report". AWEA. American Wind Energy Association. Retrieved 9 February 2017.
- "Global Wind Statistics 2017" (PDF).
- "Global Wind Report 2018" (PDF).
- "Renewable Energy Capacity Statistics 2021" (PDF).
- "Renewable Energy Capacity Statistics 2022" (PDF).
- "Renewable Energy Capacity Statistics 2023".
- "Installed Capacity - Canadian Wind Energy Association". Canadian Wind Energy Association. Retrieved 31 January 2018.
- "TÜRKİYE ELEKTRİK SİSTEMİ KURULUŞ ve KAYNAKLARA GÖRE KURULU GÜÇ" (PDF). Retrieved 5 February 2018.
- "Clean Energy Report 2011". Clean Energy Council Australia. Retrieved 1 February 2012.
- "Wind in numbers". Retrieved 13 February 2015.
- Our World in Data (2023). "Share of electricity production from wind, 2022". Retrieved 23 April 2023.
- Finnish Wind Power Association (23 January 2023). "Finnish Wind Power Statistics 2022" (PDF). p. 2/22. Retrieved 23 April 2023.
- "Vindkraftproduksjon 2013". Norwegian Water Resources and Energy Directorate. Retrieved 8 March 2014.
- "Vindkraft – produksjon i 2012" (PDF). Norwegian Water Resources and Energy Directorate. Retrieved 8 March 2014.
- "Vindkraft–Produksjonsstatistikk-2011" (PDF). Norwegian Water Resources and Energy Directorate. Retrieved 8 March 2014.
- Wind Europe (February 2023). "Wind energy in Europe: 2022 Statistics and the outlook for 2023-2027" (PDF). p. 10/58. Retrieved 23 April 2023.
- Renews Ltd (16 January 2023). "Irish wind farms supply 34% of country's power". Retrieved 23 April 2023.
- "Informe Mensual: Diciembre 2022" (PDF). CAMMESA. p. 21.
- "Current Status". Alternate Energy Development Board, Pakistan. Retrieved 3 April 2016.
- World Wind Energy Association (also wwindea.org or WWEA). See the periodical "Wind Energy International" or WWEA press releases for additional data.
- "World Wind Energy Report 2008" (PDF). Report. World Wind Energy Association. February 2009. Retrieved 19 March 2009.
- "World Wind Energy Report 2009" (PDF). Report. World Winiation. February 2010. Retrieved 13 March 2010.
- "World Wind Energy Report 2010" (PDF). Report. World Wind Energy Association. February 2011. Retrieved 13 March 2011.
- "World Wind Energy Report 2011". World Wind Energy Association.
- "World Wind Energy Report 2012". World Wind Energy Association.
- Stefan, Gsanger (21 March 2013). "World Wind Energy Report 2013". www.wwindea.org. World Wind Energy Association. Retrieved 23 September 2020.
- "Wind power generation". Our World in Data. Retrieved 19 August 2022.