Hampshire County Council elections
Hampshire County Council in England is elected every four years. Since the boundary changes in 2005, 78 councillors have been elected from 75 wards, with further boundary changes in 2017.[1][2]
Council elections
- 2001 Hampshire County Council election
- 2005 Hampshire County Council election (boundary changes increased the number of seats by 2)[3]
- 2009 Hampshire County Council election
- 2013 Hampshire County Council election
- 2017 Hampshire County Council election (boundary changes)
- 2021 Hampshire County Council election
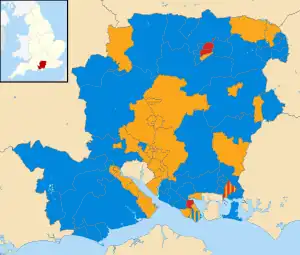
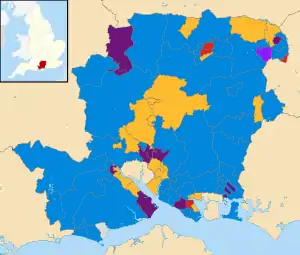
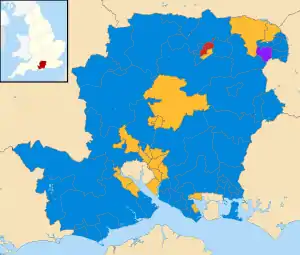
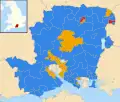
County result maps
By-election results
1997–2001
| Party | Candidate | Votes | % | ±% | |
|---|---|---|---|---|---|
| Liberal Democrats | 1,674 | 48.7 | +6.0 | ||
| Conservative | 1,628 | 47.3 | +1.8 | ||
| Labour | 138 | 4.0 | -7.8 | ||
| Majority | 46 | 1.4 | |||
| Turnout | 3,440 | 22.0 | |||
| Liberal Democrats gain from Conservative | Swing | ||||
| Party | Candidate | Votes | % | ±% | |
|---|---|---|---|---|---|
| Conservative | 742 | 43.2 | +5.9 | ||
| Labour | 564 | 32.8 | -2.4 | ||
| Liberal Democrats | 347 | 20.2 | -5.2 | ||
| Independent | 64 | 3.7 | +3.7 | ||
| Majority | 178 | 10.4 | |||
| Turnout | 1,717 | 16.5 | |||
| Conservative hold | Swing | ||||
| Party | Candidate | Votes | % | ±% | |
|---|---|---|---|---|---|
| Conservative | 741 | 47.3 | +10.9 | ||
| Liberal Democrats | 554 | 35.4 | +5.5 | ||
| Labour | 270 | 17.3 | -12.8 | ||
| Majority | 187 | 11.9 | |||
| Turnout | 1,565 | 10.6 | |||
| Conservative hold | Swing | ||||
| Party | Candidate | Votes | % | ±% | |
|---|---|---|---|---|---|
| Labour | 1,107 | 51.1 | -3.4 | ||
| Conservative | 617 | 28.5 | +2.6 | ||
| Liberal Democrats | 443 | 20.4 | +1.8 | ||
| Majority | 490 | 22.6 | |||
| Turnout | 2,167 | 20.2 | |||
| Conservative hold | Swing | ||||
| Party | Candidate | Votes | % | ±% | |
|---|---|---|---|---|---|
| Conservative | John Stocks | 1,044 | 63.9 | +28.2 | |
| Liberal Democrats | Helen Alley | 373 | 22.8 | +8.0 | |
| Labour | Peter Cotton | 217 | 13.3 | +6.5 | |
| Majority | 671 | 41.1 | |||
| Turnout | 1,634 | 13.8 | |||
| Conservative gain from Independent | Swing | ||||
2001–2005
| Party | Candidate | Votes | % | ±% | |
|---|---|---|---|---|---|
| Labour | 1,606 | 68.3 | +11.9 | ||
| Conservative | 639 | 27.2 | -6.2 | ||
| Liberal Democrats | 107 | 4.5 | -5.7 | ||
| Majority | 967 | 41.1 | |||
| Turnout | 2,352 | 21.7 | |||
| Labour hold | Swing | ||||
| Party | Candidate | Votes | % | ±% | |
|---|---|---|---|---|---|
| Liberal Democrats | John Shaw | 1,223 | 38.6 | +11.8 | |
| Conservative | Harry Robinson | 1,126 | 35.5 | +4.2 | |
| Labour | Julie Johnson | 824 | 26.0 | -15.9 | |
| Majority | 98 | 3.1 | |||
| Turnout | 3,174 | 28.5 | |||
| Liberal Democrats gain from Labour | Swing | ||||
| Party | Candidate | Votes | % | ±% | |
|---|---|---|---|---|---|
| Liberal Democrats | Lee Dunsdon | 1,796 | 66.9 | +21.0 | |
| Conservative | Alexis McEvoy | 801 | 29.8 | -7.7 | |
| Labour | Alan Goodfellow | 87 | 3.2 | -13.5 | |
| Majority | 995 | 37.1 | |||
| Turnout | 2,684 | 25.0 | |||
| Liberal Democrats hold | Swing | ||||
| Party | Candidate | Votes | % | ±% | |
|---|---|---|---|---|---|
| Liberal Democrats | Ann Buckley | 978 | 56.6 | +36.2 | |
| Labour | 433 | 25.0 | -31.0 | ||
| Conservative | 285 | 16.5 | -7.0 | ||
| Green | 33 | 1.9 | +1.9 | ||
| Majority | 545 | 31.6 | |||
| Turnout | 1,729 | 17.2 | |||
| Liberal Democrats gain from Labour | Swing | ||||
2009–2013
| Party | Candidate | Votes | % | ±% | |
|---|---|---|---|---|---|
| Conservative | Ferris Cowper | 1,588 | 64.4 | ||
| Liberal Democrats | Maureen Comber | 290 | 11.8 | ||
| Labour | John Tough | 258 | 10.5 | ||
| Green | Neville Taylor | 178 | 7.2 | ||
| Justice & Anti-Corruption Party | Don Jerrard | 146 | 5.9 | ||
| Majority | 1,298 | 52.8 | |||
| Turnout | 2,473 | 18.5 | |||
| Conservative hold | Swing | ||||
References
- "County Council Elections". Hampshire County Council. Archived from the original on 26 July 2009. Retrieved 5 September 2009.
- "LGBCE | Hampshire County Council | LGBCE Site". www.lgbce.org.uk. Retrieved 14 April 2020.
- "Local election results: Hampshire". * BBC News Online. Retrieved 5 September 2009.
- "By-Election November 2000". Hampshire County Council. Archived from the original on 8 August 2007. Retrieved 5 September 2009.
- "Victory for Lib-Dems". Hampshire Chronicle. 10 February 2003. Retrieved 5 September 2009.
- "Declaration of result of poll". New Forest District Council. Retrieved 5 September 2009.
- "Lib Dems enjoy landslide". guardian.co.uk. 3 December 2004. Retrieved 5 September 2009.
- "2011 By-Election 15/09/2011". Hampshire County Council. Retrieved 16 September 2011.
- Hampshire election results
- By-election results Archived 29 March 2010 at the Wayback Machine
External links
This article is issued from Wikipedia. The text is licensed under Creative Commons - Attribution - Sharealike. Additional terms may apply for the media files.


