Electoral history of Vladimir Zhirinovsky
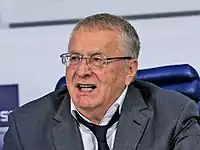
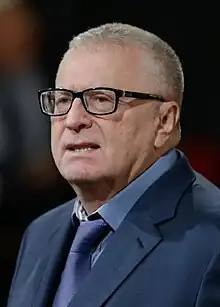
Electoral history of Vladimir Zhirinovsky, Member of the State Duma (1993–2022), Deputy Chairman of the State Duma (2000–2011) and Leader of Liberal Democratic Party (1991–2022). Liberal Democratic presidential candidate 1991, 1996, 2000, 2008, 2012 and 2018.
.png.webp)
Vladimir Zhirinovsky's results in the presidential elections from 1991 to 2018
| ||
|---|---|---|
|
Chairman of the Liberal Democratic Party of Russia 1992–2022 Elections
|
||
Presidential elections
1991
| 1991 presidential election | |||||
|---|---|---|---|---|---|
| Presidential candidate | Vice Presidential candidate | Party | Votes | % | |
| Boris Yeltsin | Alexander Rutskoy | Independent | 45,552,041 | 58.6 | |
| Nikolai Ryzhkov | Boris Gromov | Communist Party | 13,395,335 | 17.2 | |
| Vladimir Zhirinovsky | Andrey Zavidiya | Liberal Democratic Party | 6,211,007 | 8.0 | |
| Aman Tuleyev | Viktor Bocharov | Independent | 5,417,464 | 7.0 | |
| Albert Makashov | Aleksei Sergeyev | Independent | 2,969,511 | 3.8 | |
| Vadim Bakatin | Ramazan Abdulatipov | Independent | 2,719,757 | 3.5 | |
| Against all | 1,525,410 | 2.0 | |||
| Source: Nohlen & Stöver, University of Essex, Voice of Russia | |||||
1996
| First round of 1996 presidential election | ||||
|---|---|---|---|---|
| Candidate | Party | Votes | % | |
| Boris Yeltsin | Independent | 26,665,495 | 35.8 | |
| Gennady Zyuganov | Communist Party | 24,211,686 | 32.5 | |
| Alexander Lebed | Congress of Russian Communities | 10,974,736 | 14.7 | |
| Grigory Yavlinsky | Yabloko | 5,550,752 | 7.4 | |
| Vladimir Zhirinovsky | Liberal Democratic Party | 4,311,479 | 5.8 | |
| Svyatoslav Fyodorov | Party of Workers' Self-Government | 699,158 | 0.9 | |
| Mikhail Gorbachev | Independent | 386,069 | 0.5 | |
| Martin Shakkum | Independent | 277,068 | 0.4 | |
| Yury Vlasov | Independent | 151,282 | 0.2 | |
| Vladimir Bryntsalov | Russian Socialist Party | 123,065 | 0.2 | |
| Aman Tuleyev | Independent | 308 | 0.0 | |
| Against all | 1,163,921 | 1.6 | ||
| Source: Nohlen & Stöver,[1] Colton[2] | ||||
2000
| 2000 presidential election | ||||
|---|---|---|---|---|
| Candidate | Party | Votes | % | |
| Vladimir Putin | Independent | 39,740,467 | 53.4 | |
| Gennady Zyuganov | Communist Party | 21,928,468 | 29.5 | |
| Grigory Yavlinsky | Yabloko | 4,351,450 | 5.9 | |
| Aman Tuleyev | Independent | 2,217,364 | 3.0 | |
| Vladimir Zhirinovsky | Liberal Democratic Party | 2,026,509 | 2.7 | |
| Konstantin Titov | Independent | 1,107,269 | 1.5 | |
| Ella Pamfilova | For Civic Dignity | 758,967 | 1.0 | |
| Stanislav Govorukhin | Independent | 328,723 | 0.4 | |
| Yury Skuratov | Independent | 319,189 | 0.4 | |
| Alexey Podberezkin | Spiritual Heritage | 98,177 | 0.1 | |
| Umar Dzhabrailov | Independent | 78,498 | 0.1 | |
| Against all | 1,414,673 | 1.9 | ||
| Source: Nohlen & Stöver, University of Essex | ||||
2008
| 2008 presidential election | ||||
|---|---|---|---|---|
| Candidates | Party | Votes | % | |
| Dmitry Medvedev | United Russia | 52,530,712 | 71.2 | |
| Gennady Zyuganov | Communist Party | 13,243,550 | 18.0 | |
| Vladimir Zhirinovsky | Liberal Democratic Party | 6,988,510 | 9.5 | |
| Andrei Bogdanov | Democratic Party | 968,344 | 1.3 | |
| Source: Nohlen & Stöver[3] | ||||
2012
| 2012 presidential election | ||||
|---|---|---|---|---|
| Candidates | Party | Votes | % | |
| Vladimir Putin | United Russia | 45,602,075 | 63.60 | |
| Gennady Zyuganov | Communist Party | 12,318,353 | 17.18 | |
| Mikhail Prokhorov | Independent | 5,722,508 | 7.98 | |
| Vladimir Zhirinovsky | Liberal Democratic Party | 4,458,103 | 6.22 | |
| Sergey Mironov | A Just Russia | 2,763,935 | 3.85 | |
| Source: Central Election Commission of the Russian Federation | ||||
2018
| 2018 presidential election | ||||
|---|---|---|---|---|
| Candidates | Party | Votes | % | |
| Vladimir Putin | Independent | 56,430,712 | 76.69 | |
| Pavel Grudinin | Communist Party | 8,659,206 | 11.77 | |
| Vladimir Zhirinovsky | Liberal Democratic Party | 4,154,985 | 5.65 | |
| Ksenia Sobchak | Civic Initiative | 1,238,031 | 1.68 | |
| Grigory Yavlinsky | Yabloko | 769,644 | 1.05 | |
| Boris Titov | Party of Growth | 556,801 | 0.76 | |
| Maxim Suraykin | Communists of Russia | 499,342 | 0.68 | |
| Sergey Baburin | Russian All-People's Union | 479,013 | 0.65 | |
| Source: CEC | ||||
State Duma elections
1993
In 1993, Vladimir Zhirinovsky ran for the State Duma from Shchyolkovsky single-member constituency, in all subsequent elections, he ran on the party list.
| Shchyolkovsky single-member constituency | ||||
|---|---|---|---|---|
| Candidates | Party | Votes | % | |
| Vladimir Zhirinovsky | Liberal Democratic Party | 104,874 | 34.5% | |
| Others | 181,662 | 59.8% | ||
| Source: CEC | ||||
State Duma Chairman elections
2003
| Candidate | Party | For | ||
|---|---|---|---|---|
| Boris Gryzlov | United Russia | 352 | 78.2% | |
| Sergey Baburin | Rodina | 79 | 17.6% | |
| Ivan Melnikov | Communist Party | 69 | 15.3% | |
| Vladimir Zhirinovsky | Liberal Democratic Party | 51 | 11.3% | |
| Source: Спикером Госдумы избран Борис Грызлов | ||||
2011
| Candidate | Party | For | ||
|---|---|---|---|---|
| Sergey Naryshkin | United Russia | 238 | 52.9% | |
| Ivan Melnikov | Communist Party | 208 | 46.2% | |
| Vladimir Zhirinovsky | Liberal Democratic Party | 204 | 45.3% | |
| Sergey Mironov | A Just Russia | 203 | 45.1% | |
| Source: Госдума избрала своим спикером Сергея Нарышкина | ||||
Belgorod Oblast gubernatorial election, 1999
| Candidates | Party | % | ||
|---|---|---|---|---|
| Yevgeny Savchenko | Our Home – Russia | 53.4 | ||
| Mikhail Beskhmelnitsyn | Communist Party | 19.8 | ||
| Vladimir Zhirinovsky | Liberal Democratic Party | 17.4 | ||
| Vladimir Bezymyanny | Independent | 2.0 | ||
| Vladimir Naboka | Independent | 0.3 | ||
| Source: Губернаторские выборы - 1999 | ||||
References
- Nohlen, D; Stöver, P (2010). Elections in Europe: A data handbook. p. 1642. ISBN 978-3-8329-5609-7.
- Timothy J. Colton (2000). Transitional Citizens: Voters and What Influences Them in the New Russia. pp. 234–5. ISBN 9780674029804.
{{cite book}}:|work=ignored (help) - Nohlen, D & Stöver, P (2010) Elections in Europe: A data handbook, p1661 ISBN 9783832956097
This article is issued from Wikipedia. The text is licensed under Creative Commons - Attribution - Sharealike. Additional terms may apply for the media files.


