Electoral district of Lytton
Lytton is an electoral district of the Legislative Assembly in the Australian state of Queensland.[1]
| Lytton Queensland—Legislative Assembly | |||||||||||||||
|---|---|---|---|---|---|---|---|---|---|---|---|---|---|---|---|
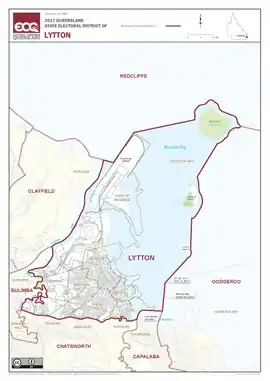 Electoral map of Lytton 2017 | |||||||||||||||
| State | Queensland | ||||||||||||||
| MP | Joan Pease | ||||||||||||||
| Party | Labor Party | ||||||||||||||
| Namesake | Lytton | ||||||||||||||
| Electors | 37,369 (2020) | ||||||||||||||
| Area | 65 km2 (25.1 sq mi) | ||||||||||||||
| Demographic | Inner-metropolitan | ||||||||||||||
| Coordinates | 27°24′S 153°11′E | ||||||||||||||
| |||||||||||||||
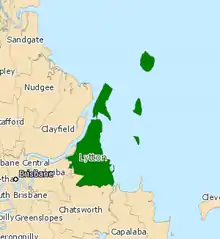
Electoral map of Lytton 2008
The district is based in the eastern suburbs of Brisbane, to the south of the Brisbane River. It is named for the suburb of Lytton and also includes the suburbs of Hemmant, Lota, Manly and Wynnum, as well as the Port of Brisbane. The electorate was first created for the 1972 election.
Lytton is normally a safe Labor Party seat, although it was won in 2012 by the Liberal National Party.
Members for Lytton
| Member | Party | Term | |
|---|---|---|---|
| Tom Burns | Labor | 1972–1996 | |
| Paul Lucas | Labor | 1996–2012 | |
| Neil Symes | Liberal National | 2012–2015 | |
| Joan Pease | Labor | 2015–present | |
Election results
| Party | Candidate | Votes | % | ±% | |
|---|---|---|---|---|---|
| Labor | Joan Pease | 17,067 | 52.21 | +3.28 | |
| Liberal National | Gordon Walters | 9,955 | 30.45 | +6.13 | |
| Greens | Ken Austin | 3,450 | 10.55 | −0.79 | |
| One Nation | Debra Smith | 1,289 | 3.94 | −11.46 | |
| Informed Medical Options | Georgia Phillips | 606 | 1.85 | +1.85 | |
| United Australia | Jonathan Spaits | 321 | 0.98 | +0.98 | |
| Total formal votes | 32,688 | 97.45 | +0.69 | ||
| Informal votes | 856 | 2.55 | −0.69 | ||
| Turnout | 33,544 | 89.76 | −0.10 | ||
| Two-party-preferred result | |||||
| Labor | Joan Pease | 20,708 | 63.35 | +1.33 | |
| Liberal National | Gordon Walters | 11,980 | 36.65 | −1.33 | |
| Labor hold | Swing | +1.33 | |||
Primary vote results in Lytton (Parties that have never gotten 5% of the vote are omitted)
Labor
Liberal National
- Liberal
- National
Greens
One Nation
Australian Democrats
Katter's Australian
Queensland Labor
Independent
Two-candidate-preferred vote results in Lytton
References
- "Representatives of Queensland State Electorates 1860-2017" (PDF). Queensland Parliamentary Record 2012-2017: The 55th Parliament. Queensland Parliament. Archived from the original (PDF) on 27 April 2020.
- 2020 State General Election – Lytton – District Summary, ECQ.
External links
- Green, Antony (9 June 2023). "Electorate Profile". Australian Broadcasting Corporation.
This article is issued from Wikipedia. The text is licensed under Creative Commons - Attribution - Sharealike. Additional terms may apply for the media files.