Doncourt-lès-Conflans
Doncourt-lès-Conflans (French pronunciation: [dɔ̃kuʁ lɛ kɔ̃flɑ̃]) is a commune in the Meurthe-et-Moselle department in north-eastern France. It is the location of the Doncourt-lès-Conflans Airport, a general aviation facility.
Doncourt-lès-Conflans | |
|---|---|
 The church in Doncourt-lès-Conflans | |
 Coat of arms | |
Location of Doncourt-lès-Conflans | |
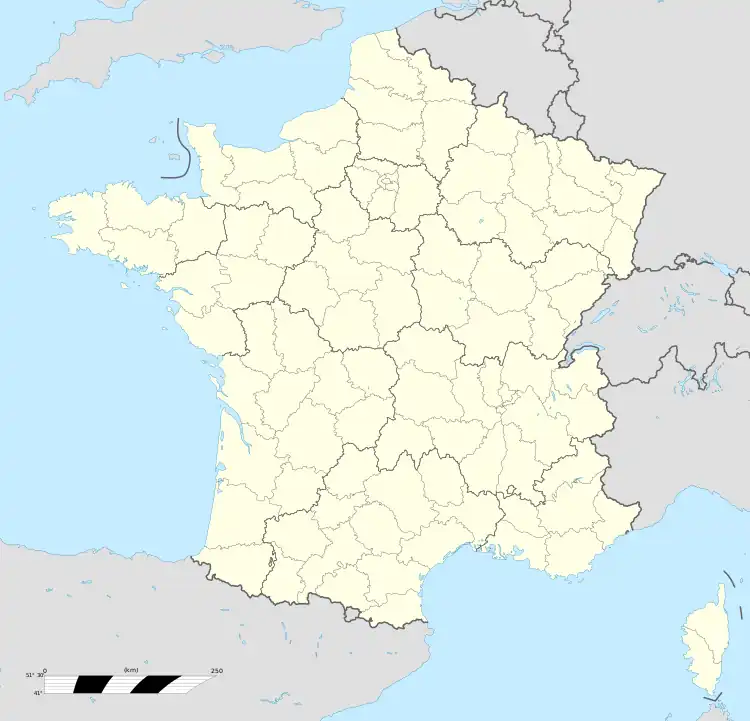 Doncourt-lès-Conflans 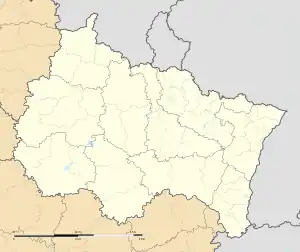 Doncourt-lès-Conflans | |
| Coordinates: 49°08′41″N 5°56′05″E | |
| Country | France |
| Region | Grand Est |
| Department | Meurthe-et-Moselle |
| Arrondissement | Briey |
| Canton | Jarny |
| Intercommunality | Orne Lorraine Confluences |
| Government | |
| • Mayor (2020–2026) | Alain Frantz[1] |
| Area 1 | 7.34 km2 (2.83 sq mi) |
| Population | 1,141 |
| • Density | 160/km2 (400/sq mi) |
| Time zone | UTC+01:00 (CET) |
| • Summer (DST) | UTC+02:00 (CEST) |
| INSEE/Postal code | 54171 /54800 |
| Elevation | 202–282 m (663–925 ft) (avg. 246 m or 807 ft) |
| 1 French Land Register data, which excludes lakes, ponds, glaciers > 1 km2 (0.386 sq mi or 247 acres) and river estuaries. | |
Geography
Climate
Doncourt-lès-Conflans has a oceanic climate (Köppen climate classification Cfb). The average annual temperature in Doncourt-lès-Conflans is 10.7 °C (51.3 °F). The average annual rainfall is 710.3 mm (27.96 in) with May as the wettest month. The temperatures are highest on average in July, at around 19.3 °C (66.7 °F), and lowest in January, at around 2.5 °C (36.5 °F). The highest temperature ever recorded in Doncourt-lès-Conflans was 40.9 °C (105.6 °F) on 25 July 2019; the coldest temperature ever recorded was −16.5 °C (2.3 °F) on 26 December 2010.
| Climate data for Doncourt-lès-Conflans (1991−2020 normals, extremes 2005−present) | |||||||||||||
|---|---|---|---|---|---|---|---|---|---|---|---|---|---|
| Month | Jan | Feb | Mar | Apr | May | Jun | Jul | Aug | Sep | Oct | Nov | Dec | Year |
| Record high °C (°F) | 14.7 (58.5) |
21.5 (70.7) |
26.0 (78.8) |
28.8 (83.8) |
33.3 (91.9) |
36.7 (98.1) |
40.9 (105.6) |
38.1 (100.6) |
36.2 (97.2) |
26.9 (80.4) |
21.6 (70.9) |
16.1 (61.0) |
40.9 (105.6) |
| Average high °C (°F) | 5.2 (41.4) |
6.8 (44.2) |
11.4 (52.5) |
16.8 (62.2) |
19.9 (67.8) |
23.8 (74.8) |
26.1 (79.0) |
24.9 (76.8) |
21.5 (70.7) |
15.7 (60.3) |
9.6 (49.3) |
6.0 (42.8) |
15.6 (60.1) |
| Daily mean °C (°F) | 2.5 (36.5) |
3.3 (37.9) |
6.4 (43.5) |
10.3 (50.5) |
13.7 (56.7) |
17.2 (63.0) |
19.3 (66.7) |
18.7 (65.7) |
15.4 (59.7) |
11.3 (52.3) |
6.5 (43.7) |
3.4 (38.1) |
10.7 (51.3) |
| Average low °C (°F) | −0.3 (31.5) |
−0.2 (31.6) |
1.4 (34.5) |
3.8 (38.8) |
7.5 (45.5) |
10.7 (51.3) |
12.6 (54.7) |
12.4 (54.3) |
9.2 (48.6) |
6.9 (44.4) |
3.5 (38.3) |
0.7 (33.3) |
5.7 (42.3) |
| Record low °C (°F) | −14.7 (5.5) |
−16.0 (3.2) |
−10.7 (12.7) |
−6.9 (19.6) |
−3.4 (25.9) |
1.1 (34.0) |
2.3 (36.1) |
3.1 (37.6) |
−1.3 (29.7) |
−6.1 (21.0) |
−9.3 (15.3) |
−16.5 (2.3) |
−16.5 (2.3) |
| Average precipitation mm (inches) | 56.7 (2.23) |
53.2 (2.09) |
55.1 (2.17) |
38.8 (1.53) |
72.1 (2.84) |
65.6 (2.58) |
60.3 (2.37) |
67.0 (2.64) |
54.2 (2.13) |
58.9 (2.32) |
57.7 (2.27) |
70.7 (2.78) |
710.3 (27.96) |
| Average precipitation days (≥ 1.0 mm) | 12.0 | 10.5 | 9.9 | 6.9 | 10.5 | 9.5 | 8.9 | 9.5 | 7.5 | 9.6 | 11.4 | 12.6 | 118.8 |
| Source: Météo-France[3] | |||||||||||||
References
- "Répertoire national des élus: les maires". data.gouv.fr, Plateforme ouverte des données publiques françaises (in French). 2 December 2020.
- "Populations légales 2020". The National Institute of Statistics and Economic Studies. 29 December 2022.
- "Fiche Climatologique Statistiques 1991-2020 et records" (PDF). Météo-France. Retrieved 23 August 2022.