Division of Bass (state)
The electoral division of Bass is one of the five electorates in the Tasmanian House of Assembly, it includes north-east Tasmania and Flinders Island. Bass takes its name from the British naval surgeon and explorer of Australia: George Bass. The division shares its name and boundaries with the federal division of Bass.
| Bass Tasmania—House of Assembly | |||||||||||||||
|---|---|---|---|---|---|---|---|---|---|---|---|---|---|---|---|
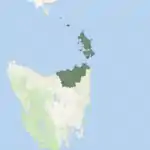
Map showing the Division of Bass, as of the Tasmanian state election, 2018.[1] | |||||||||||||||
| State | Tasmania | ||||||||||||||
| Created | 1909 | ||||||||||||||
| MP | Lara Alexander (Liberal) Michael Ferguson (Liberal) Janie Finlay (Labor) Michelle O'Byrne (Labor) Simon Wood (Liberal) | ||||||||||||||
| Party | Labor (2), Liberal (3) | ||||||||||||||
| Namesake | George Bass | ||||||||||||||
| Electors | 78,182 (2021) | ||||||||||||||
| Area | 7,976 km2 (3,079.6 sq mi) | ||||||||||||||
| Demographic | Mixed | ||||||||||||||
| Federal electorate(s) | Bass | ||||||||||||||
| |||||||||||||||
Division of Bass
Bass and the other House of Assembly electoral divisions are each represented by five members elected under the Hare-Clark electoral system.
History and electoral profile
Bass was created in 1909 and includes the city of Launceston and towns in the states north east including: Scottsdale, Lilydale, St Helens, George Town and others.[2]
Representation
Distribution of seats
|
| ||||||||||||||||||||||||||||||||||||||||||||||||||||||||||||||||||||||||||||||||||||||||||||||||||||||||||||||||||||||||||||||||||||||||||||||||||||||||||||||||||||||||||||||||||||||||||||||||||||||||||||||||||||||||||||||||||||||||||||||||||||||||||||||||||||||||||||||||||||||||||||||||
Members for Bass
Election results
| Party | Candidate | Votes | % | ±% | |
|---|---|---|---|---|---|
| Quota | 11,226 | ||||
| Liberal | Peter Gutwein (elected 1) | 32,482 | 48.2 | +24.8 | |
| Liberal | Michael Ferguson (elected 3) | 3,806 | 5.7 | −15.3 | |
| Liberal | Sarah Courtney (elected 2) | 2,227 | 3.3 | −5.9 | |
| Liberal | Simon Wood | 707 | 1.0 | −1.4 | |
| Liberal | Greg Kieser | 646 | 1.0 | +1.0 | |
| Liberal | Lara Alexander | 511 | 0.8 | +0.8 | |
| Labor | Michelle O'Byrne (elected 4) | 7,813 | 11.6 | −5.2 | |
| Labor | Janie Finlay (elected 5) | 5,830 | 8.7 | +8.7 | |
| Labor | Adrian Hinds | 1,663 | 2.5 | +2.5 | |
| Labor | Jennifer Houston | 1,512 | 2.2 | −1.2 | |
| Labor | Owen Powell | 706 | 1.0 | −0.6 | |
| Greens | Jack Davenport | 2,952 | 4.4 | +4.4 | |
| Greens | Anne Layton-Bennett | 1,091 | 1.6 | +1.6 | |
| Greens | Tom Hall | 886 | 1.3 | +0.7 | |
| Greens | Cecily Rosol | 691 | 1.0 | +1.0 | |
| Greens | Mitchell Houghton | 561 | 0.8 | +0.8 | |
| Shooters, Fishers, Farmers | Andrew Harvey | 1,649 | 2.4 | +2.4 | |
| Animal Justice | Sue Woodbury | 1,242 | 1.8 | +1.8 | |
| Independent | Roy Ramage | 377 | 0.6 | +0.6 | |
| Total formal votes | 67,352 | 95.0 | +0.1 | ||
| Informal votes | 3,544 | 5.0 | −0.1 | ||
| Turnout | 70,896 | 90.7 | −1.1 | ||
| Party total votes | |||||
| Liberal | 40,379 | 60.0 | +1.1 | ||
| Labor | 17,524 | 26.0 | −0.4 | ||
| Greens | 6,181 | 9.2 | −0.1 | ||
| Shooters, Fishers, Farmers | 1,649 | 2.4 | +2.4 | ||
| Animal Justice | 1,242 | 1.8 | +1.8 | ||
| Independent | Roy Ramage | 377 | 0.6 | +0.6 | |
| Liberal hold | Swing | +24.8 | |||
| Liberal hold | Swing | –15.3 | |||
| Liberal hold | Swing | –5.9 | |||
| Labor hold | Swing | –5.2 | |||
| Labor hold | Swing | +8.7 | |||
See also
References
- Map data: Electoral boundaries from Administrative Boundaries [May 2016] ©PSMA Australia Limited licensed by the Commonwealth of Australia under Creative Commons Attribution 4.0 International licence (CC BY 4.0).
- Bass Archived 2013-04-11 at the Wayback Machine, Tasmanian Electoral Commission
- "2021 Results for Bass". Tasmanian Electoral Commission. Retrieved 11 May 2021.
External links
This article is issued from Wikipedia. The text is licensed under Creative Commons - Attribution - Sharealike. Additional terms may apply for the media files.