Can-avid
Can-avid (IPA: [ˌkɐnˈʔavɪd]), officially the Municipality of Can-avid (Waray: Bungto han Can-avid; Tagalog: Bayan ng Can-avid), is a 4th class municipality in the province of Eastern Samar, Philippines. According to the 2020 census, it has a population of 21,682 people.[3]
Can-avid | |
|---|---|
| Municipality of Can-avid | |
 Flag | |
| Motto(s): Upai Can-avid... Upayon Ta, Panlawas, Agrikultura ngan mga Industriya han Can-avid | |
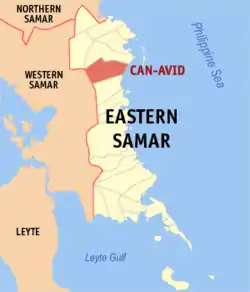 Map of Eastern Samar with Can-avid highlighted | |
OpenStreetMap | |
.svg.png.webp) Can-avid Location within the Philippines | |
| Coordinates: 12°00′N 125°27′E | |
| Country | Philippines |
| Region | Eastern Visayas |
| Province | Eastern Samar |
| District | Lone district |
| Founded | July 4, 1948 |
| Barangays | 28 (see Barangays) |
| Government | |
| • Type | Sangguniang Bayan |
| • Mayor | Gil Norman P. Germino |
| • Vice Mayor | Vilma A. Germino |
| • Representative | Maria Fe R. Abunda |
| • Councilors | List |
| • Electorate | 16,128 voters (2022) |
| Area | |
| • Total | 288.7 km2 (111.5 sq mi) |
| Elevation | 14 m (46 ft) |
| Highest elevation | 105 m (344 ft) |
| Lowest elevation | 0 m (0 ft) |
| Population (2020 census)[3] | |
| • Total | 21,682 |
| • Density | 75/km2 (190/sq mi) |
| • Households | 5,102 |
| Economy | |
| • Income class | 4th municipal income class |
| • Poverty incidence | 52.20 |
| • Revenue | ₱ 151.3 million (2020) |
| • Assets | ₱ 507.5 million (2020) |
| • Expenditure | ₱ 110.4 million (2020) |
| • Liabilities | ₱ 178.3 million (2020) |
| Service provider | |
| • Electricity | Eastern Samar Electric Cooperative (ESAMELCO) |
| Time zone | UTC+8 (PST) |
| ZIP code | 6806 |
| PSGC | |
| IDD : area code | +63 (0)55 |
| Native languages | Waray Tagalog |
| Website | www |
History
Can-avid was created in 1948 from the barrios of Can-avid, Carolina, Barok, Cansangaya, Mabuhay, Camantang, Canilay, Pandol and Balagon, formerly part of Dolores, Eastern Samar, by virtue of Republic Act No. 264.[5]
Geography
Barangays
Can-avid is politically subdivided into 28 barangays. [6] Each barangay consists of puroks and some have sitios.
- Balagon
- Baruk
- Boco
- Caghalong
- Camantang
- Can-ilay
- Cansangaya
- Canteros
- Carolina
- Guibuangan
- Jepaco
- Mabuhay
- Malogo
- Obong
- Pandol
- Barangay 1 Poblacion
- Barangay 2 Poblacion
- Barangay 3 Poblacion
- Barangay 4 Poblacion
- Barangay 5 Poblacion
- Barangay 6 Poblacion
- Barangay 7 Poblacion
- Barangay 8 Poblacion
- Barangay 9 Poblacion
- Barangay 10 Poblacion
- Salvacion
- Solong
- Rawis
Climate
| Climate data for Can-avid, Eastern Samar | |||||||||||||
|---|---|---|---|---|---|---|---|---|---|---|---|---|---|
| Month | Jan | Feb | Mar | Apr | May | Jun | Jul | Aug | Sep | Oct | Nov | Dec | Year |
| Average high °C (°F) | 27 (81) |
27 (81) |
28 (82) |
29 (84) |
30 (86) |
30 (86) |
29 (84) |
29 (84) |
29 (84) |
29 (84) |
28 (82) |
28 (82) |
29 (83) |
| Average low °C (°F) | 22 (72) |
22 (72) |
22 (72) |
23 (73) |
24 (75) |
24 (75) |
24 (75) |
24 (75) |
24 (75) |
24 (75) |
23 (73) |
23 (73) |
23 (74) |
| Average precipitation mm (inches) | 97 (3.8) |
64 (2.5) |
69 (2.7) |
58 (2.3) |
98 (3.9) |
161 (6.3) |
167 (6.6) |
140 (5.5) |
158 (6.2) |
171 (6.7) |
169 (6.7) |
154 (6.1) |
1,506 (59.3) |
| Average rainy days | 17.1 | 13.4 | 14.8 | 15.2 | 21.1 | 25.2 | 26.8 | 25.4 | 25.5 | 26.5 | 23.0 | 20.3 | 254.3 |
| Source: Meteoblue (Use with caution: this is modeled/calculated data, not measured locally.)[7] | |||||||||||||
Demographics
| Year | Pop. | ±% p.a. |
|---|---|---|
| 1948 | 5,987 | — |
| 1960 | 8,409 | +2.87% |
| 1970 | 9,695 | +1.43% |
| 1975 | 11,135 | +2.82% |
| 1980 | 12,196 | +1.84% |
| 1990 | 13,254 | +0.84% |
| 1995 | 15,759 | +3.30% |
| 2000 | 17,228 | +1.93% |
| 2007 | 18,173 | +0.74% |
| 2010 | 19,785 | +3.14% |
| 2015 | 21,015 | +1.16% |
| 2020 | 21,682 | +0.62% |
| Source: Philippine Statistics Authority[8][9][10][11] | ||
In the 2020 census, the population of Can-avid, Eastern Samar, was 21,682 people,[3] with a density of 75 inhabitants per square kilometre or 190 inhabitants per square mile.
Economy
References
- Municipality of Can-avid | (DILG)
- "2015 Census of Population, Report No. 3 – Population, Land Area, and Population Density" (PDF). Philippine Statistics Authority. Quezon City, Philippines. August 2016. ISSN 0117-1453. Archived (PDF) from the original on May 25, 2021. Retrieved July 16, 2021.
- Census of Population (2020). "Region VIII (Eastern Visayas)". Total Population by Province, City, Municipality and Barangay. Philippine Statistics Authority. Retrieved 8 July 2021.
- "PSA Releases the 2018 Municipal and City Level Poverty Estimates". Philippine Statistics Authority. 15 December 2021. Retrieved 22 January 2022.
- "An act to create the municipality of Can-avid in the province of Samar". LawPH.com. Retrieved 2011-04-08.
- "Province: Eastern Samar". PSGC Interactive. Quezon City, Philippines: Philippine Statistics Authority. Retrieved 12 November 2016.
- "Can-avid, Eastern Samar : Average Temperatures and Rainfall". Meteoblue. Retrieved 30 December 2018.
- Census of Population (2015). "Region VIII (Eastern Visayas)". Total Population by Province, City, Municipality and Barangay. Philippine Statistics Authority. Retrieved 20 June 2016.
- Census of Population and Housing (2010). "Region VIII (Eastern Visayas)" (PDF). Total Population by Province, City, Municipality and Barangay. National Statistics Office. Retrieved 29 June 2016.
- Censuses of Population (1903–2007). "Region VIII (Eastern Visayas)". Table 1. Population Enumerated in Various Censuses by Province/Highly Urbanized City: 1903 to 2007. National Statistics Office.
- "Province of Eastern Samar". Municipality Population Data. Local Water Utilities Administration Research Division. Retrieved 17 December 2016.
- "Poverty incidence (PI):". Philippine Statistics Authority. Retrieved December 28, 2020.
- "Estimation of Local Poverty in the Philippines" (PDF). Philippine Statistics Authority. 29 November 2005.
- "2003 City and Municipal Level Poverty Estimates" (PDF). Philippine Statistics Authority. 23 March 2009.
- "City and Municipal Level Poverty Estimates; 2006 and 2009" (PDF). Philippine Statistics Authority. 3 August 2012.
- "2012 Municipal and City Level Poverty Estimates" (PDF). Philippine Statistics Authority. 31 May 2016.
- "Municipal and City Level Small Area Poverty Estimates; 2009, 2012 and 2015". Philippine Statistics Authority. 10 July 2019.
- "PSA Releases the 2018 Municipal and City Level Poverty Estimates". Philippine Statistics Authority. 15 December 2021. Retrieved 22 January 2022.
External links
- Philippine Standard Geographic Code
- Philippine Census Information
- Local Governance Performance Management System
Places adjacent to Can-avid | ||||||||||||||||
|---|---|---|---|---|---|---|---|---|---|---|---|---|---|---|---|---|
| ||||||||||||||||
Borongan (capital and largest city) | |
| Municipalities | |
| Component city | |