Barcelona, Sorsogon
Barcelona, officially the Municipality of Barcelona (Waray Sorsogon: Bungto san Barcelona; Waray: Bungto han Barcelona, Tagalog: Bayan ng Barcelona), is a 5th class municipality in the province of Sorsogon, Philippines. According to the 2020 census, it has a population of 20,987 people.[3]
Barcelona | |
|---|---|
| Municipality of Barcelona | |
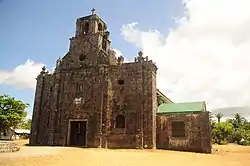
 Parroquia de San Jose | |
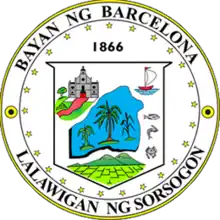
 Flag  Seal | |
| Nickname: Catalonia of Asia | |
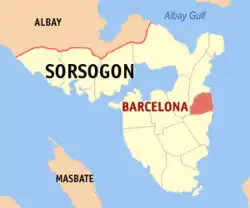
 Map of Sorsogon with Barcelona highlighted | |
OpenStreetMap | |
.svg.png.webp) Barcelona Location within the Philippines | |
| Coordinates: 12°52′10″N 124°08′31″E | |
| Country | Philippines |
| Region | Bicol Region |
| Province | Sorsogon |
| District | 2nd district |
| Founded | April 16, 1886 |
| Named for | Barcelona, Catalonia |
| Barangays | 25 (see Barangays) |
| Government | |
| • Type | Sangguniang Bayan |
| • Mayor | Cynthia G. Falcotelo-Fortes |
| • Vice Mayor | Maria F. Fortades |
| • Representative | Manuel L. Fortes, Jr |
| • Municipal Council | Members |
| • Electorate | 16,497 voters (2022) |
| Area | |
| • Total | 61.18 km2 (23.62 sq mi) |
| Elevation | 18 m (59 ft) |
| Highest elevation | 126 m (413 ft) |
| Lowest elevation | 0 m (0 ft) |
| Population (2020 census)[3] | |
| • Total | 20,987 |
| • Density | 340/km2 (890/sq mi) |
| • Households | 5,255 |
| Economy | |
| • Income class | 5th municipal income class |
| • Poverty incidence | 28.35 |
| • Revenue | ₱ 190.5 million (2020) |
| • Assets | ₱ 319.9 million (2020) |
| • Expenditure | ₱ 111.4 million (2020) |
| • Liabilities | ₱ 40.33 million (2020) |
| Service provider | |
| • Electricity | Sorsogon 2 Electric Cooperative (SORECO 2) |
| Time zone | UTC+8 (PST) |
| ZIP code | 4712 |
| PSGC | |
| IDD : area code | +63 (0)56 |
| Native languages | Sorsogon Tagalog |
| Website | www |
It is bounded by Gubat in the north, Bulusan in the south, Casiguran in the west and Philippine Sea in the east.
History
The site of Barcelona was originally part of Gubat and Bulusan. The town's name was known as Danlog, taken from the name of a local river. The change of name to Barcelona was recommended by a Spanish official who saw some similarities with Barcelona, Catalonia (Spain). On April 16, 1886, it became a pueblo civil. Until 1868, it was part of the parish of St. James the Great of Bulusan. After 1868, it took St. Joseph as its patron saint and celebrates their town fiesta on May 19.[5]
For most of the Fourth and Fifth Republics, it was governed by Mayors Rustico Estopace and Salvador Estuye. Barcelona is best known for its abundant supply of coconuts, copra, and root crops such as sweet potato & cassava.
Geography
Barangays
Barcelona is politically subdivided into 25 barangays. Each barangay consists of puroks and some have sitios.
In 1957, the name of barrio Paghabulan was changed to Peña Francia.[6]
- Alegria
- Bagacay
- Bangate
- Bugtong
- Cagang
- Fabrica
- Jibong
- Lago
- Layog
- Luneta
- Macabari
- Mapapac
- Olandia
- Paghaluban
- Poblacion Central
- Poblacion Norte
- Poblacion Sur
- Putiao
- San Antonio
- San Isidro
- San Ramon (Tan-awan)
- San Vicente
- Santa Cruz
- Santa Lourdes
- Tagdon
Climate
| Climate data for Barcelona, Sorsogon | |||||||||||||
|---|---|---|---|---|---|---|---|---|---|---|---|---|---|
| Month | Jan | Feb | Mar | Apr | May | Jun | Jul | Aug | Sep | Oct | Nov | Dec | Year |
| Average high °C (°F) | 27 (81) |
28 (82) |
29 (84) |
31 (88) |
31 (88) |
30 (86) |
29 (84) |
29 (84) |
29 (84) |
29 (84) |
29 (84) |
28 (82) |
29 (84) |
| Average low °C (°F) | 22 (72) |
21 (70) |
22 (72) |
23 (73) |
24 (75) |
25 (77) |
25 (77) |
25 (77) |
25 (77) |
24 (75) |
23 (73) |
23 (73) |
24 (74) |
| Average precipitation mm (inches) | 65 (2.6) |
44 (1.7) |
42 (1.7) |
39 (1.5) |
87 (3.4) |
150 (5.9) |
184 (7.2) |
153 (6.0) |
163 (6.4) |
154 (6.1) |
127 (5.0) |
100 (3.9) |
1,308 (51.4) |
| Average rainy days | 13.9 | 9.2 | 11.0 | 12.5 | 19.6 | 24.3 | 26.5 | 25.0 | 25.5 | 24.4 | 19.4 | 15.1 | 226.4 |
| Source: Meteoblue[7] | |||||||||||||
Demographics
.png.webp)

| Year | Pop. | ±% p.a. |
|---|---|---|
| 1903 | 6,001 | — |
| 1918 | 9,044 | +2.77% |
| 1939 | 8,968 | −0.04% |
| 1948 | 9,287 | +0.39% |
| 1960 | 14,478 | +3.77% |
| 1970 | 13,845 | −0.45% |
| 1975 | 14,406 | +0.80% |
| 1980 | 16,063 | +2.20% |
| 1990 | 16,251 | +0.12% |
| 1995 | 18,405 | +2.36% |
| 2000 | 19,041 | +0.73% |
| 2007 | 19,428 | +0.28% |
| 2010 | 20,340 | +1.68% |
| 2015 | 20,990 | +0.60% |
| 2020 | 20,987 | −0.00% |
| Source: Philippine Statistics Authority[8][9][10][11] | ||
Economy
References
- Municipality of Barcelona | (DILG)
- "2015 Census of Population, Report No. 3 – Population, Land Area, and Population Density" (PDF). Philippine Statistics Authority. Quezon City, Philippines. August 2016. ISSN 0117-1453. Archived (PDF) from the original on May 25, 2021. Retrieved July 16, 2021.
- Census of Population (2020). "Region V (Bicol Region)". Total Population by Province, City, Municipality and Barangay. Philippine Statistics Authority. Retrieved 8 July 2021.
- "PSA Releases the 2018 Municipal and City Level Poverty Estimates". Philippine Statistics Authority. 15 December 2021. Retrieved 22 January 2022.
- Page 407 (Cristina D. Jose, Facts about Sorogon [mimeographed]), Philippines: A History of the Bikol Region, Jaime T. Malanyaon, 1991
- "An Act Changing the Name of Barrio Paghaluban, Municipality of Barcelona, Province of Sorsogon, to Peña Francia". LawPH.com. Archived from the original on 2012-07-10. Retrieved 2011-04-12.
- "Barcelona, Sorsogon : Average Temperatures and Rainfall". Meteoblue. Retrieved 29 December 2018.
- Census of Population (2015). "Region V (Bicol Region)". Total Population by Province, City, Municipality and Barangay. Philippine Statistics Authority. Retrieved 20 June 2016.
- Census of Population and Housing (2010). "Region V (Bicol Region)". Total Population by Province, City, Municipality and Barangay. National Statistics Office. Retrieved 29 June 2016.
- Censuses of Population (1903–2007). "Region V (Bicol Region)". Table 1. Population Enumerated in Various Censuses by Province/Highly Urbanized City: 1903 to 2007. National Statistics Office.
- "Province of Sorsogon". Municipality Population Data. Local Water Utilities Administration Research Division. Retrieved 17 December 2016.
- "Poverty incidence (PI):". Philippine Statistics Authority. Retrieved December 28, 2020.
- "Estimation of Local Poverty in the Philippines" (PDF). Philippine Statistics Authority. 29 November 2005.
- "2003 City and Municipal Level Poverty Estimates" (PDF). Philippine Statistics Authority. 23 March 2009.
- "City and Municipal Level Poverty Estimates; 2006 and 2009" (PDF). Philippine Statistics Authority. 3 August 2012.
- "2012 Municipal and City Level Poverty Estimates" (PDF). Philippine Statistics Authority. 31 May 2016.
- "Municipal and City Level Small Area Poverty Estimates; 2009, 2012 and 2015". Philippine Statistics Authority. 10 July 2019.
- "PSA Releases the 2018 Municipal and City Level Poverty Estimates". Philippine Statistics Authority. 15 December 2021. Retrieved 22 January 2022.