2021 Warrington Borough Council election
The 2021 Warrington Borough Council election took place on 6 May 2021 to elect members of Warrington Borough Council in England. This was on the same day as other local elections. All 58 seats were up for election.
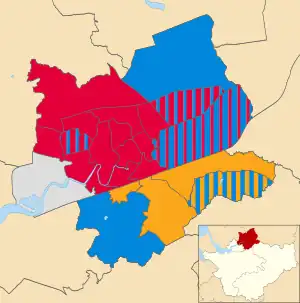
Map showing the results of the 2021 Warrington Borough Council election
These elections were originally scheduled for May 2020, but were delayed by one year due to the COVID-19 pandemic.[1]
The Labour Party retained overall control of Warrington Borough Council after winning 35 of the 58 seats.
Results
| Party | Seats | Gains | Losses | Net gain/loss | Seats % | Votes % | Votes | +/− | |
|---|---|---|---|---|---|---|---|---|---|
| Labour | 35 | 0 | 10 | 60.35 | 38.90 | 54,519 | |||
| Conservative | 11 | 10 | 1 | 18.96 | 36.64 | 51,345 | |||
| Liberal Democrats | 9 | 1 | 3 | 15.52 | 16.04 | 22,479 | |||
| Independent | 3 | 3 | 0 | 5.17 | 6.10 | 8,552 | |||
| Green | 0 | 0 | 0 | 0.00 | 2.32 | 3,242 | |||
Council composition
Prior to the election the composition of the council was:
| 45 | 11 | 2 |
| Labour | Lib Dem | Con |
After the election the composition of the council was:
| 35 | 11 | 9 | 3 |
| Labour | Conservative | Lib Dem | IND |
Lib Dem – Liberal Democrats
Con – Conservative
IND – Independent
Ward Results
Incumbent councillors are denoted by an asterisk (*). References:[2]
Appleton
| Party | Candidate | Votes | % | ±% | |
|---|---|---|---|---|---|
| Conservative | Mark Christopher Jervis | 2,024 | 47.5 | +16.6 | |
| Conservative | Ghazala Chapman | 1,989 | 46.7 | +21.1 | |
| Conservative | Kenneth David Critchley | 1,926 | 45.2 | +24.2 | |
| Liberal Democrats | Peter Russell Lewenz | 1,628 | 38.2 | -24.7 | |
| Liberal Democrats | Sharon Alicia Harris* | 1,551 | 36.4 | -10.7 | |
| Liberal Democrats | Mark Damen Browne | 1,497 | 35.1 | -23.4 | |
| Labour | Denis James Thomas Matthews | 529 | 12.4 | -3.6 | |
| Labour | Robin Michael David Frith | 511 | 12.0 | N/A | |
| Labour | Andrew Alexander Warnock-Smith | 478 | 11.2 | N/A | |
| Turnout | 4,278 | 50.59 | +8.59 | ||
| Conservative gain from Liberal Democrats | Swing | ||||
| Conservative gain from Liberal Democrats | Swing | ||||
| Conservative gain from Liberal Democrats | Swing | ||||
Bewsey and Whitecross
| Party | Candidate | Votes | % | ±% | |
|---|---|---|---|---|---|
| Labour Co-op | Sarah Edith Hall* | 1,046 | 53.2 | -13.1 | |
| Labour Co-op | Steve Wright* | 925 | 47.1 | -15.6 | |
| Labour Co-op | Tom Jennings* | 879 | 44.7 | -16.9 | |
| Conservative | Cecilia Margaret Critchley | 453 | 23.1 | +9.5 | |
| Independent | Beth Trainer | 423 | 21.5 | N/A | |
| Conservative | Anthony John Kerrigan | 390 | 19.8 | +7.6 | |
| Conservative | Carl Andrew Olsen | 344 | 17.5 | N/A | |
| Liberal Democrats | Robert Timmis | 340 | 17.3 | -1.2 | |
| Turnout | 1,986 | 22.78 | +0.78 | ||
| Labour hold | Swing | ||||
| Labour hold | Swing | ||||
| Labour hold | Swing | ||||
Birchwood
| Party | Candidate | Votes | % | ±% | |
|---|---|---|---|---|---|
| Labour | Russ Bowden* | 1,521 | 52.2 | -7.4 | |
| Labour | David Michael Ellis | 1,389 | 47.7 | -7.1 | |
| Conservative | Nigel William Balding | 1,076 | 37.0 | +9.9 | |
| Labour | Judith Mary Guthrie | 1,073 | 36.8 | -14.4 | |
| Conservative | Craig Peter Allen | 1,068 | 36.7 | +15.3 | |
| Conservative | Paul Adam Young | 743 | 25.5 | N/A | |
| Liberal Democrats | Matt Scott | 351 | 12.1 | +1.6 | |
| Liberal Democrats | David John Eccles | 298 | 10.2 | N/A | |
| Turnout | 2,928 | 35.05 | +0.05 | ||
| Labour hold | Swing | ||||
| Labour hold | Swing | ||||
| Conservative gain from Labour | Swing | ||||
Burtonwood & Winwick
| Party | Candidate | Votes | % | ±% | |
|---|---|---|---|---|---|
| Labour | Alex Abbey | 986 | 54.1 | -8.6 | |
| Labour | Cathy Mitchell* | 958 | 52.6 | -11.1 | |
| Conservative | Paul Thomas Campbell | 579 | 31.8 | +8.3 | |
| Conservative | Theresa-Jane Murray | 564 | 31.0 | N/A | |
| Liberal Democrats | Edgar John Davies | 108 | 5.9 | -9.7 | |
| Turnout | 1,843 | 36.38 | +2.38 | ||
| Labour hold | Swing | ||||
| Labour hold | Swing | ||||
Chapelford and Old Hall
| Party | Candidate | Votes | % | ±% | |
|---|---|---|---|---|---|
| Labour Co-op | Steve Parish* | 1,224 | 41.8 | -1.9 | |
| Labour Co-op | Paul Joseph Warburton | 1,186 | 40.5 | -15.6 | |
| Conservative | Linda Margaret Butler | 1,104 | 37.7 | +15.4 | |
| Labour Co-op | Rebecca Anne Knowles* | 1,088 | 37.1 | -1.0 | |
| Conservative | Ian Anthony Wilson | 972 | 33.2 | +19.5 | |
| Conservative | Summit Tuli | 908 | 31.0 | +18.5 | |
| Liberal Democrats | Allan Keith Bird | 567 | 19.4 | -6.9 | |
| Green | Sarah Louise Williamson | 465 | 15.9 | N/A | |
| Green | Michael Andrew Wass | 204 | 7.0 | -0.7 | |
| Liberal Democrats | Cliff Taylor | 168 | 5.7 | -11.7 | |
| Turnout | 2,965 | 33.68 | +2.68 | ||
| Labour hold | Swing | ||||
| Labour hold | Swing | ||||
| Conservative gain from Labour | Swing | ||||
Culcheth, Glazebury & Croft
| Party | Candidate | Votes | % | ±% | |
|---|---|---|---|---|---|
| Conservative | Carol Ruth Benson | 1,942 | 48.7 | +8.8 | |
| Conservative | Valerie Margaret Allen | 1,923 | 48.3 | +11.2 | |
| Conservative | Wendy Maisey | 1,845 | 46.3 | +7.6 | |
| Labour | Matt Smith* | 1,556 | 39.0 | -13.5 | |
| Labour | Ben Alldred | 1,442 | 36.2 | -11.1 | |
| Labour | Jan Davidson* | 1,154 | 29.0 | -12.1 | |
| Green | Gary Lloyd Williams | 520 | 13.0 | N/A | |
| Liberal Democrats | Eddie Sloane | 362 | 9.1 | -3.6 | |
| Turnout | 4,013 | 45.43 | +5.43 | ||
| Conservative gain from Labour | Swing | ||||
| Conservative gain from Labour | Swing | ||||
| Conservative gain from Labour | Swing | ||||
Fairfield and Howley
| Party | Candidate | Votes | % | ±% | |
|---|---|---|---|---|---|
| Labour | Jean Flaherty* | 1,201 | 60.5 | +3.3 | |
| Labour | Tony Higgins* | 1,057 | 53.2 | +6.5 | |
| Labour | Sagheer Zaman | 883 | 44.5 | -1.7 | |
| Conservative | Stephen Crawshaw | 538 | 27.1 | +11.7 | |
| Conservative | Simone Samantha-Louise Davies | 446 | 22.5 | N/A | |
| Conservative | Peter John Donleavy | 397 | 20.0 | N/A | |
| Green | Denise Jane Harris | 304 | 15.3 | -0.6 | |
| Liberal Democrats | Constance Merril Cummerson | 178 | 9.0 | -2.1 | |
| Green | Jamie Martin | 177 | 8.9 | N/A | |
| Turnout | 1,997 | 23.38 | -3.62 | ||
| Labour hold | Swing | ||||
| Labour hold | Swing | ||||
| Labour hold | Swing | ||||
Grappenhall
| Party | Candidate | Votes | % | ±% | |
|---|---|---|---|---|---|
| Liberal Democrats | Ryan Stephen Robert Bate* | 1,335 | 49.1 | -3.3 | |
| Liberal Democrats | Michael John Biggin* | 1,136 | 41.8 | -19.4 | |
| Conservative | Simon Christopher Brookes | 1,052 | 38.7 | +12.2 | |
| Conservative | Joanne Shanthi Freeman | 803 | 29.5 | +9.8 | |
| Labour | David Cundy | 261 | 9.6 | -8.2 | |
| Labour | Stephen James Price | 258 | 9.5 | N/A | |
| Green | Kenneth Robin Wilson | 194 | 7.1 | N/A | |
| Turnout | 2,741 | 49.40 | +14.40 | ||
| Liberal Democrats hold | Swing | ||||
| Liberal Democrats hold | Swing | ||||
Great Sankey North and Whittle Hall
| Party | Candidate | Votes | % | ±% | |
|---|---|---|---|---|---|
| Labour | Jane Whalen | 1,184 | 40.4 | -13.8 | |
| Labour | Hitesh Patel | 1,143 | 39.0 | -12.9 | |
| Labour | Janet Henshaw | 1,007 | 34.3 | -15.7 | |
| Conservative | Pete Pinnington | 824 | 28.1 | -0.6 | |
| Conservative | Oliver James Paterson | 766 | 26.1 | -1.3 | |
| Independent | Nigel John Catlow | 722 | 24.6 | N/A | |
| Conservative | Theo Jairaj Mirfin | 644 | 22.0 | -5.1 | |
| Independent | Dave Clark | 542 | 18.5 | N/A | |
| Green | Stephanie Davies | 432 | 14.7 | +1.1 | |
| Liberal Democrats | Anthony James Tobin | 277 | 9.4 | -4.1 | |
| Turnout | 2,953 | 37.34 | +2.34 | ||
| Labour hold | Swing | ||||
| Labour hold | Swing | ||||
| Labour hold | Swing | ||||
Great Sankey South
| Party | Candidate | Votes | % | ±% | |
|---|---|---|---|---|---|
| Labour | Amanda Marie King* | 1,512 | 60.5 | -2.4 | |
| Labour | Laura Watson | 1,415 | 56.6 | +4.2 | |
| Labour | Mo Hussain | 1,363 | 54.6 | +3.9 | |
| Conservative | Adam Thomas Patrick Wilson | 916 | 36.7 | +12.7 | |
| Conservative | Christopher Goldie | 855 | 34.2 | +12.5 | |
| Conservative | Ash Prakash | 803 | 32.1 | +14.4 | |
| Liberal Democrats | Roy Alfred Smith | 379 | 15.2 | +5.2 | |
| Turnout | 2,530 | 30.10 | +3.40 | ||
| Labour hold | Swing | ||||
| Labour hold | Swing | ||||
| Labour hold | Swing | ||||
Latchford East
| Party | Candidate | Votes | % | ±% | |
|---|---|---|---|---|---|
| Labour Co-op | Hans Josef Mundry* | 922 | 59.9 | -6.9 | |
| Labour Co-op | Karen Elizabeth Mundry* | 917 | 59.6 | +0.5 | |
| Conservative | Heather Winifred Allan | 377 | 24.5 | +10.7 | |
| Conservative | Tobias Sebastian Fox | 375 | 24.4 | +14.0 | |
| Liberal Democrats | Denis Patrick McAllister | 149 | 9.7 | -0.4 | |
| Turnout | 1,558 | 24.05 | +1.05 | ||
| Labour hold | Swing | ||||
| Labour hold | Swing | ||||
Latchford West
| Party | Candidate | Votes | % | ±% | |
|---|---|---|---|---|---|
| Labour | Maureen Penelope McLaughlin* | 909 | 43.1 | -10.6 | |
| Labour | Les Morgan* | 859 | 40.7 | -17.2 | |
| Conservative | Amanda Louise Bowles | 793 | 37.6 | +20.2 | |
| Conservative | Stephen Howard Taylor | 787 | 37.3 | +20.1 | |
| Liberal Democrats | Sally Jane Chisholm | 207 | 9.8 | -5.5 | |
| Liberal Democrats | Julia Kate Stansfield | 169 | 8.0 | -6.7 | |
| Turnout | 2,128 | 36.07 | +4.07 | ||
| Labour hold | Swing | ||||
| Labour hold | Swing | ||||
Lymm North and Thelwall
| Party | Candidate | Votes | % | ±% | |
|---|---|---|---|---|---|
| Liberal Democrats | Bob Barr* | 2,129 | 52.2 | -2.7 | |
| Liberal Democrats | Ian George Marks* | 2,103 | 51.6 | -1.0 | |
| Liberal Democrats | Wendy Johnson* | 1,735 | 42.6 | -3.0 | |
| Conservative | Stephen Philip Chadwick | 1,211 | 29.7 | +6.5 | |
| Conservative | Julia Frances Leigh | 1,210 | 29.7 | +9.8 | |
| Conservative | Roger Nicholas Longton | 1,100 | 27.0 | +8.6 | |
| Labour | Chris Brownhill | 900 | 22.1 | -2.1 | |
| Labour | Ken Wormald | 657 | 16.1 | N/A | |
| Labour | Marc Victor Rufus | 601 | 14.7 | N/A | |
| Turnout | 4,095 | 45.10 | +4.10 | ||
| Liberal Democrats hold | Swing | ||||
| Liberal Democrats hold | Swing | ||||
| Liberal Democrats hold | Swing | ||||
Lymm South
| Party | Candidate | Votes | % | ±% | |
|---|---|---|---|---|---|
| Conservative | Kath Buckley* | 1,119 | 44.4 | +4.8 | |
| Liberal Democrats | Graham Farrington Gowland | 1,019 | 40.4 | +10.3 | |
| Liberal Democrats | Tim Martland | 895 | 35.5 | +0.4 | |
| Conservative | Ian Pemberton | 859 | 34.0 | -7.7 | |
| Labour | Trish Cockayne | 382 | 15.1 | -5.9 | |
| Labour | Cheryl Marie Anderson | 296 | 11.7 | N/A | |
| Independent | Joe Griffiths | 239 | 9.5 | N/A | |
| Turnout | 2,529 | 49.67 | +5.67 | ||
| Conservative hold | Swing | ||||
| Liberal Democrats gain from Conservative | Swing | ||||
Orford
| Party | Candidate | Votes | % | ±% | |
|---|---|---|---|---|---|
| Labour | Helen Charlotte Milner | 1,036 | 45.0 | -23.1 | |
| Labour | Claire Ellen Lloyd-Fitzgerald | 984 | 42.7 | -20.0 | |
| Labour | Morgan Alan William Tarr* | 856 | 37.2 | -19.1 | |
| Conservative | Carol Anne Kilgannon | 772 | 33.5 | +26.5 | |
| Conservative | Stephen Murphy | 742 | 32.2 | N/A | |
| Conservative | Nicholas Forshaw | 651 | 28.3 | N/A | |
| Independent | Trevor Nicholls | 349 | 15.1 | N/A | |
| Liberal Democrats | Celia Elizabeth Jordan | 170 | 7.4 | +1.1 | |
| Turnout | 2,322 | 26.18 | +1.18 | ||
| Labour hold | Swing | ||||
| Labour hold | Swing | ||||
| Labour hold | Swing | ||||
Penketh and Cuerdley
| Party | Candidate | Votes | % | ±% | |
|---|---|---|---|---|---|
| Independent | Andy Heaver | 1,473 | 42.1 | N/A | |
| Independent | Geoffrey Fellows | 1,391 | 39.8 | N/A | |
| Independent | Craig Joseph Lenihan | 1,361 | 38.9 | N/A | |
| Labour | Linda Susan Dirir* | 1,038 | 29.7 | -19.9 | |
| Labour | Amy Charlotte Brookes | 1,021 | 29.2 | -24.0 | |
| Conservative | Michael Andrew Potts | 943 | 27.0 | -16.2 | |
| Labour | Kenny Watson | 827 | 23.6 | -25.1 | |
| Conservative | Lucy Gemma Davies | 795 | 22.7 | -13.0 | |
| Conservative | Matthew Marshall | 678 | 19.4 | -14.4 | |
| Liberal Democrats | Pam Todd | 143 | 4.1 | -4.2 | |
| Turnout | 3,530 | 42.74 | +5.74 | ||
| Independent gain from Labour | Swing | ||||
| Independent gain from Labour | Swing | ||||
| Independent gain from Labour | Swing | ||||
Poplars and Hulme
| Party | Candidate | Votes | % | ±% | |
|---|---|---|---|---|---|
| Labour | Nathan James John Sudworth | 1,047 | 58.2 | +2.0 | |
| Labour | John Sidney Kerr-Brown* | 942 | 52.4 | -9.2 | |
| Labour | Hilary Cooksey* | 887 | 49.3 | -7.6 | |
| Conservative | Chloe Demi Birchall | 578 | 32.1 | +20.7 | |
| Conservative | Rowland Blackstock | 382 | 21.2 | N/A | |
| Conservative | Charles Basil Mitchell | 360 | 20.0 | N/A | |
| Independent | Mal Lingley | 241 | 13.4 | -9.3 | |
| Liberal Democrats | Mike Anderson | 125 | 6.9 | -0.4 | |
| Turnout | 1,812 | 20.53 | -2.47 | ||
| Labour hold | Swing | ||||
| Labour hold | Swing | ||||
| Labour hold | Swing | ||||
Poulton North
| Party | Candidate | Votes | % | ±% | |
|---|---|---|---|---|---|
| Labour | Diana Friend* | 1,172 | 43.2 | -13.5 | |
| Labour | Graham Jeffrey Friend* | 1,126 | 41.5 | -15.2 | |
| Labour | Sue Emery | 956 | 35.3 | -13.8 | |
| Conservative | William David Gibson | 804 | 29.7 | +1.7 | |
| Conservative | Ben Anthony Duncanson | 799 | 29.5 | N/A | |
| Green | Geoff Settle | 727 | 26.8 | N/A | |
| Conservative | Isaac Tweedale | 709 | 26.2 | N/A | |
| Independent | Jon Parr | 544 | 20.1 | N/A | |
| Liberal Democrats | Scott Wilson | 203 | 7.5 | -21.7 | |
| Liberal Democrats | Tim Harwood | 152 | 5.6 | N/A | |
| Turnout | 2,724 | 33.97 | +1.97 | ||
| Labour hold | Swing | ||||
| Labour hold | Swing | ||||
| Labour hold | Swing | ||||
Poulton South
| Party | Candidate | Votes | % | ±% | |
|---|---|---|---|---|---|
| Labour | Maureen Ann Creaghan* | 788 | 48.3 | +0.8 | |
| Labour | Stephen John Rydzkowski | 745 | 45.6 | -16.3 | |
| Conservative | Howard Martin Klein | 594 | 36.4 | +13.7 | |
| Conservative | Steven William Stewart | 540 | 33.1 | N/A | |
| Liberal Democrats | David Crowther | 144 | 8.8 | -2.9 | |
| Liberal Democrats | Daniel Gregory Warren | 136 | 8.3 | N/A | |
| Turnout | 1,650 | 34.21 | +4.21 | ||
| Labour hold | Swing | ||||
| Labour hold | Swing | ||||
Rixton and Woolston
| Party | Candidate | Votes | % | ±% | |
|---|---|---|---|---|---|
| Conservative | Joshua Thomas Dixon | 1,250 | 42.2 | +20.4 | |
| Labour | Andrew John Hill* | 1,157 | 39.1 | -8.1 | |
| Conservative | Phil Eastty | 1,120 | 37.9 | +20.0 | |
| Labour | Pat Wright* | 1,069 | 36.1 | -2.0 | |
| Conservative | Rob Tynan | 1,064 | 36.0 | +20.0 | |
| Labour | Faisal Rashid | 970 | 32.8 | -18.3 | |
| Independent | Paul Andrew Bray | 412 | 13.9 | N/A | |
| Liberal Democrats | Helen Speed | 295 | 10.0 | +3.5 | |
| Liberal Democrats | Brian Alistair Meichen | 294 | 9.9 | N/A | |
| Turnout | 2,978 | 38.90 | +4.90 | ||
| Conservative gain from Labour | Swing | ||||
| Labour hold | Swing | ||||
| Conservative gain from Labour | Swing | ||||
Stockton Heath
| Party | Candidate | Votes | % | ±% | |
|---|---|---|---|---|---|
| Liberal Democrats | Judith Carol Wheeler | 1,012 | 38.9 | +3.6 | |
| Liberal Democrats | Peter John Walker* | 999 | 38.4 | -8.9 | |
| Conservative | Bill Kidley | 885 | 34.0 | +4.7 | |
| Conservative | Lyndsey Jane Olsen | 837 | 32.2 | +7.0 | |
| Labour | Laurence James Murphy | 504 | 19.4 | -7.3 | |
| Labour | Gary Leonard Slater | 444 | 17.1 | -5.6 | |
| Green | Lyndsay McAteer | 219 | 8.4 | +2.0 | |
| Turnout | 2,620 | 46.27 | +5.27 | ||
| Liberal Democrats hold | Swing | ||||
| Liberal Democrats hold | Swing | ||||
Westbrook
| Party | Candidate | Votes | % | ±% | |
|---|---|---|---|---|---|
| Labour | Siobhan Maureen Carr | 659 | 34.5 | -4.6 | |
| Labour | Brian Gallagher | 619 | 32.4 | +1.6 | |
| Conservative | Marta Anna Paszkowska | 610 | 31.9 | +13.1 | |
| Conservative | Nisha Jethalal Shah | 507 | 26.5 | N/A | |
| Independent | Debra Laura Duddle | 428 | 22.4 | N/A | |
| Independent | Jason Ian Webb | 427 | 22.3 | N/A | |
| Liberal Democrats | Judith Mary Walker | 114 | 6.0 | -47.4 | |
| Liberal Democrats | Brian Michael Davies | 110 | 5.8 | -23.9 | |
| Turnout | 1,916 | 36.93 | +4.93 | ||
| Labour gain from Liberal Democrats | Swing | ||||
| Labour hold | Swing | ||||
By-elections
Grappenhall
| Party | Candidate | Votes | % | ±% | |
|---|---|---|---|---|---|
| Liberal Democrats | Helen Speed | 1,073 | 42.9 | N/A | |
| Liberal Democrats | Mark Browne | 1,047 | 41.8 | N/A | |
| Conservative | Moira Dolan | 524 | 20.9 | N/A | |
| Conservative | Philip Ford | 462 | 18.5 | N/A | |
| Labour | Denis Matthews | 193 | 7.7 | N/A | |
| Green | Denise Harris | 135 | 5.4 | N/A | |
| Turnout | 2,502 | 44.3 | |||
| Registered electors | 5,645 | ||||
| Liberal Democrats hold | |||||
| Liberal Democrats hold | |||||
Rixton & Woolston
| Party | Candidate | Votes | % | ±% | |
|---|---|---|---|---|---|
| Conservative | Rob Tynan | 648 | 42.9 | +2.8 | |
| Labour | Anne Cockayne | 645 | 42.7 | +5.5 | |
| Liberal Democrats | Brian Meichen | 219 | 14.5 | +5.0 | |
| Majority | 3 | 0.2 | |||
| Turnout | 1,512 | 20.5 | |||
| Registered electors | 7,366 | ||||
| Conservative hold | Swing | ||||
Latchford West
| Party | Candidate | Votes | % | ±% | |
|---|---|---|---|---|---|
| Labour | Denis Matthews | 662 | 40.8 | –6.8 | |
| Conservative | Stephen Taylor | 488 | 30.1 | –11.4 | |
| Liberal Democrats | Sharon Harris | 274 | 16.9 | +6.1 | |
| Independent | Amanda Bowles | 199 | 12.3 | N/A | |
| Majority | 174 | 10.7 | |||
| Turnout | 1,628 | 28.3 | |||
| Registered electors | 5,752 | ||||
| Labour hold | Swing | ||||
Poulton North
| Party | Candidate | Votes | % | ±% | |
|---|---|---|---|---|---|
| Labour | Una Gillham | 999 | 56.3 | +22.3 | |
| Conservative | Howard Klein | 606 | 34.2 | +10.9 | |
| Liberal Democrats | Timothy Harwood | 168 | 9.5 | +3.6 | |
| Majority | 393 | 22.1 | |||
| Turnout | 1,788 | 23.1 | |||
| Registered electors | 7,758 | ||||
| Labour hold | Swing | ||||
References
- Skentelbery, Gary (13 March 2020). "Local Elections postponed for one year due to Coronavirus". Warrington Worldwide. Archived from the original on 14 May 2021. Retrieved 16 May 2021.
- "Declaration of the Result of Poll Election of Councillors for the Appleton Ward" (PDF). warrington.gov.uk. 6 May 2021. Archived (PDF) from the original on 14 May 2021. Retrieved 16 May 2021.
| Cheshire East Council | |
|---|---|
| Cheshire West and Chester Council | |
| Halton Borough Council | |
| Warrington Borough Council | |
| Cheshire County Council |
|
| Chester City Council |
|
| Congleton Borough Council |
|
| Crewe and Nantwich Borough Council |
|
| Ellesmere Port and Neston Borough Council | |
| Macclesfield Borough Council | |
| Vale Royal Borough Council |
|
See also: Wards, Boundary changes | |
This article is issued from Wikipedia. The text is licensed under Creative Commons - Attribution - Sharealike. Additional terms may apply for the media files.