2010 United Kingdom general election in Wales
These are the results of the 2010 United Kingdom general election in Wales. The election was held on 6 May 2010, and all 40 parliamentary seats in Wales were contested. The Labour Party remained the party with the most seats in Wales, however it suffered a net loss of 4 seats and its share of the vote dropped by 6.5%. The Conservatives increased their number of seats by 5 and the Liberal Democrats and Plaid Cymru saw little change both in the number of seats and share of the vote.
| |||||||||||||||||||||||||||||||||||||||||||||||||||||||||||||||||||||||
All 40 Welsh seats to the House of Commons | |||||||||||||||||||||||||||||||||||||||||||||||||||||||||||||||||||||||
|---|---|---|---|---|---|---|---|---|---|---|---|---|---|---|---|---|---|---|---|---|---|---|---|---|---|---|---|---|---|---|---|---|---|---|---|---|---|---|---|---|---|---|---|---|---|---|---|---|---|---|---|---|---|---|---|---|---|---|---|---|---|---|---|---|---|---|---|---|---|---|---|
| |||||||||||||||||||||||||||||||||||||||||||||||||||||||||||||||||||||||
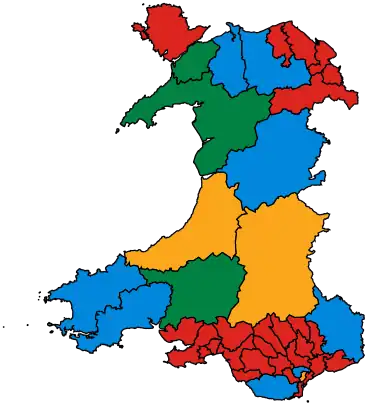 Colours on map indicate winning party for each constituency †Notional 2005 results on new boundaries. *Owing to electoral boundaries changing, this figure is notional. | |||||||||||||||||||||||||||||||||||||||||||||||||||||||||||||||||||||||
.jpg.webp)

.jpg.webp)
Despite the Labour party winning the most votes in Wales, the Conservatives won across the UK.[2]
Results
| Party | Seats | Votes | |||||||
|---|---|---|---|---|---|---|---|---|---|
| Total | Gains | Losses | Net +/- | % seats | Total | % | Change | ||
| Labour | 26 | 1 | 5 | 65.0 | 531,601 | 36.2 | |||
| Conservative | 8 | 5 | 0 | 20.0 | 382,730 | 26.1 | |||
| Liberal Democrats | 3 | 0 | 1 | 7.5 | 295,164 | 20.1 | |||
| Plaid Cymru | 3 | 1 | 0 | 7.5 | 165,394 | 11.3 | |||
| UKIP | 0 | 0 | 0 | 0 | — | 35,690 | 2.4 | ||
| BNP | 0 | 0 | 0 | 0 | — | 23,088 | 1.6 | ||
| Green | 0 | 0 | 0 | 0 | — | 6,293 | 0.4 | ||
| Christian | 0 | 0 | 0 | 0 | — | 1,947 | 0.1 | N/A | |
| TUSC | 0 | 0 | 0 | 0 | — | 341 | 0.0 | N/A | |
| Others | 0 | 0 | 1 | — | 24,442 | 1.7 | |||
| Total | 40 | 1,466,690 | 64.9 | ||||||
References
- "Election 2010 | Results | Wales". BBC News. Retrieved 4 February 2021.
- "UK Election Statistics: 1918-2022, A Long Century of Elections" (PDF). House of Commons Library. p. 22.
| Senedd elections | |
|---|---|
| UK elections |
|
| Local elections | |
| Referendums | |
This article is issued from Wikipedia. The text is licensed under Creative Commons - Attribution - Sharealike. Additional terms may apply for the media files.