2007 Bassetlaw District Council election
The 2007 Bassetlaw District Council election took place on 3 May 2007 to elect members of Bassetlaw District Council in Nottinghamshire, England. One third of the council was up for election.
| |||||||||||||||||||||
One third of seats to Bassetlaw District Council (16 seats) 25 seats needed for a majority | |||||||||||||||||||||
|---|---|---|---|---|---|---|---|---|---|---|---|---|---|---|---|---|---|---|---|---|---|
| Turnout | 32.1% | ||||||||||||||||||||
| |||||||||||||||||||||
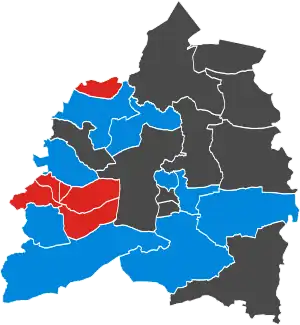 No election Colours denote the winning party, as shown in the main table of results. | |||||||||||||||||||||
| |||||||||||||||||||||
Election result
The Conservative Party retained control of the council, winning nine of sixteen seats up for election, and twenty-seven seats overall. Notably, the Liberal Democrats lost their only seat on the council to the Conservatives in the Ranskill ward.
| Overall result | ||||
|---|---|---|---|---|
| Party | Seats (2007) |
Seats (Council) |
Seats (Change) | |
| Conservative | 9 | 27 | -1 | |
| Labour | 6 | 16 | +2 | |
| Independent | 1 | 5 | - | |
| Registered electors | 62,838 | |||
| Votes cast | 20,181 | |||
| Turnout | 32.1% | |||
Ward results
Blyth
| Party | Candidate | Votes | % | ±% | |
|---|---|---|---|---|---|
| Conservative | Terry Yates | 509 | 74.7% | ||
| Labour | Peter Abell | 172 | 25.3% | ||
| Turnout | 681 | 38.4% | |||
| Registered electors | 1,801 | ||||
Carlton
| Party | Candidate | Votes | % | ±% | |
|---|---|---|---|---|---|
| Conservative | David Hare | 903 | 52.0% | ||
| Labour | Gary Moore | 832 | 48.0% | ||
| Turnout | 1,735 | 37.3% | |||
| Registered electors | 4,663 | ||||
East Markham
| Party | Candidate | Votes | % | ±% | |
|---|---|---|---|---|---|
| Conservative | John Ogle | 734 | 83.5% | ||
| Labour | Roderick Pickford | 145 | 16.5% | ||
| Turnout | 879 | 47.7% | |||
| Registered electors | 1,843 | ||||
East Retford East
| Party | Candidate | Votes | % | ±% | |
|---|---|---|---|---|---|
| Conservative | Jim Holland | 1,197 | 67.5% | ||
| Labour | Pam Skelding | 577 | 32.5% | ||
| Turnout | 1,774 | 32.9% | |||
| Registered electors | 5,483 | ||||
East Retford North
| Party | Candidate | Votes | % | ±% | |
|---|---|---|---|---|---|
| Conservative | Mike Pugsley | 1,094 | 61.4% | ||
| Labour | Vaughan Thomas | 689 | 38.6% | ||
| Turnout | 1,783 | 37.7% | |||
| Registered electors | 4,801 | ||||
Harworth
| Party | Candidate | Votes | % | ±% | |
|---|---|---|---|---|---|
| Labour | John Clayton | 1,066 | 71.2% | ||
| Conservative | Carole Mangham | 431 | 28.8% | ||
| Turnout | 1,497 | 25.9% | |||
| Registered electors | 5,800 | ||||
Rampton
| Party | Candidate | Votes | % | ±% | |
|---|---|---|---|---|---|
| Conservative | Jeffery Rickells | Unopposed | |||
Ranskill
| Party | Candidate | Votes | % | ±% | |
|---|---|---|---|---|---|
| Conservative | Michael Gray | 392 | 57.2% | ||
| Labour | Viv Thomas | 152 | 22.2% | ||
| Liberal Democrats | Mark Hunter | 141 | 20.6% | ||
| Turnout | 685 | 38.2% | |||
| Registered electors | 1,776 | ||||
Sturton
| Party | Candidate | Votes | % | ±% | |
|---|---|---|---|---|---|
| Independent | Hugh Burton | 640 | 83.6% | ||
| Labour | Cadell Thomas | 126 | 16.4% | ||
| Turnout | 766 | 43.4% | |||
| Registered electors | 1,775 | ||||
Welbeck
| Party | Candidate | Votes | % | ±% | |
|---|---|---|---|---|---|
| Conservative | Mary Stokes | 401 | 59.1% | ||
| Labour | Robin Carrington-Wilde | 277 | 40.9% | ||
| Turnout | 678 | 41.1% | |||
| Registered electors | 1,661 | ||||
Worksop East
| Party | Candidate | Votes | % | ±% | |
|---|---|---|---|---|---|
| Labour | Cliff Entwistle | 953 | 57.9% | ||
| Independent | Martin Introna | 692 | 42.1% | ||
| Turnout | 1,645 | 32.5% | |||
| Registered electors | 5,071 | ||||
Worksop North
| Party | Candidate | Votes | % | ±% | |
|---|---|---|---|---|---|
| Labour | Bill Barker | 981 | 55.2% | ||
| Conservative | Vicky Wanless | 795 | 44.8% | ||
| Turnout | 1,776 | 27.8% | |||
| Registered electors | 6,412 | ||||
Worksop North East
| Party | Candidate | Votes | % | ±% | |
|---|---|---|---|---|---|
| Labour | Simon Greaves | 905 | 52.6% | ||
| Conservative | Barry Bowles | 816 | 47.4% | ||
| Turnout | 1,721 | 34.2% | |||
| Registered electors | 5,084 | ||||
Worksop North West
| Party | Candidate | Votes | % | ±% | |
|---|---|---|---|---|---|
| Labour | Alan Rhodes | 893 | 59.0% | ||
| Conservative | Tracey Taylor | 621 | 41.0% | ||
| Turnout | 1,514 | 27.5% | |||
| Registered electors | 5,553 | ||||
Worksop South
| Party | Candidate | Votes | % | ±% | |
|---|---|---|---|---|---|
| Conservative | Julie Smith | 1,217 | 67.5% | ||
| Labour | Mick Golding | 587 | 32.5% | ||
| Turnout | 1,804 | 33.5% | |||
| Registered electors | 5,466 | ||||
Worksop South East
| Party | Candidate | Votes | % | ±% | |
|---|---|---|---|---|---|
| Labour | Josie Potts | 917 | 73.8% | ||
| Conservative | Philip Smith | 326 | 26.2% | ||
| Turnout | 1,243 | 22.3% | |||
| Registered electors | 5,649 | ||||
References
This article is issued from Wikipedia. The text is licensed under Creative Commons - Attribution - Sharealike. Additional terms may apply for the media files.