2006 Barrow-in-Furness Borough Council election
Elections to Barrow-in-Furness Borough Council were held on 4 May 2006. One third of the council was up for election and the Labour party lost overall control of the council to no overall control.
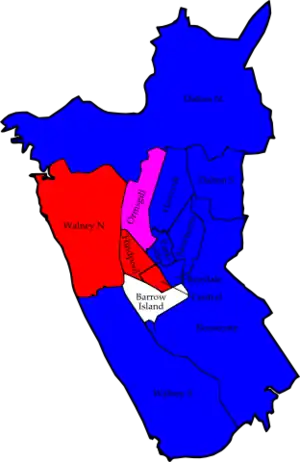
Map of the results of the 2006 Barrow-in-Furness council election. Conservative in blue, Labour in red, independent in white and People's Party in pink.
After the election, the composition of the council was
- Labour 18
- Conservative 17
- Independent 2
- People's Party 1
Election result
| Party | Seats | Gains | Losses | Net gain/loss | Seats % | Votes % | Votes | +/− | |
|---|---|---|---|---|---|---|---|---|---|
| Conservative | 10 | 5 | 0 | +5 | 66.7 | 52.2 | 8,850 | +12.2% | |
| Labour | 3 | 0 | 6 | -6 | 20.0 | 33.8 | 5,730 | -5.0% | |
| Independent | 1 | 0 | 0 | 0 | 6.7 | 8.8 | 1,483 | -0.3% | |
| Socialist People's Party | 1 | 1 | 0 | +1 | 6.7 | 5.2 | 876 | -3.2% | |
Ward results
| Party | Candidate | Votes | % | ±% | |
|---|---|---|---|---|---|
| Independent | James Tongue | 375 | 69.2 | -0.5 | |
| Labour | Colin Thomson | 167 | 30.8 | +0.5 | |
| Majority | 208 | 38.4 | -1.0 | ||
| Turnout | 542 | ||||
| Independent hold | Swing | ||||
| Party | Candidate | Votes | % | ±% | |
|---|---|---|---|---|---|
| Labour | Mary Irwin | 314 | 39.0 | -8.5 | |
| Socialist People's Party | Rosemary Hamezeian | 281 | 34.9 | +16.6 | |
| Conservative | Desmond English | 210 | 26.1 | +9.2 | |
| Majority | 33 | 4.1 | -25.1 | ||
| Turnout | 805 | ||||
| Labour hold | Swing | ||||
| Party | Candidate | Votes | % | ±% | |
|---|---|---|---|---|---|
| Conservative | Lynn Murray | 725 | 52.3 | +13.4 | |
| Labour | Dennis Bell | 661 | 47.7 | +16.9 | |
| Majority | 64 | 4.6 | -3.5 | ||
| Turnout | 1,386 | ||||
| Conservative gain from Labour | Swing | ||||
| Party | Candidate | Votes | % | ±% | |
|---|---|---|---|---|---|
| Conservative | Frank Murray | 666 | 50.3 | +11.2 | |
| Labour | Charles Bell | 657 | 49.7 | +9.9 | |
| Majority | 9 | 0.6 | |||
| Turnout | 1,323 | ||||
| Conservative hold | Swing | ||||
| Party | Candidate | Votes | % | ±% | |
|---|---|---|---|---|---|
| Conservative | John Joughin | 1,416 | 88.2 | +6.4 | |
| Labour | Rebecca Melling | 190 | 11.8 | -6.4 | |
| Majority | 1,226 | 76.4 | +12.8 | ||
| Turnout | 1,606 | ||||
| Conservative hold | Swing | ||||
| Party | Candidate | Votes | % | ±% | |
|---|---|---|---|---|---|
| Labour | David Pidduck | 471 | 57.9 | +6.8 | |
| Conservative | John Murray | 343 | 42.1 | +21.7 | |
| Majority | 128 | 15.8 | -12.6 | ||
| Turnout | 814 | ||||
| Labour hold | Swing | ||||
| Party | Candidate | Votes | % | ±% | |
|---|---|---|---|---|---|
| Conservative | Sheila Pears | 735 | |||
| Conservative | Dorothy Dawes | 640 | |||
| Independent | Nicholas Roberts | 365 | |||
| Labour | Marie Derbyshire | 309 | |||
| Labour | Malcolm Lawson | 306 | |||
| Turnout | 2,355 | ||||
| Conservative hold | Swing | ||||
| Conservative hold | Swing | ||||
| Party | Candidate | Votes | % | ±% | |
|---|---|---|---|---|---|
| Socialist People's Party | Jim Hamezeian | 395 | 39.8 | +6.3 | |
| Labour | Tricia Kegg | 247 | 24.9 | -11.2 | |
| Conservative | Tina Macur | 238 | 24.0 | +6.2 | |
| Independent | Margaret Arts | 113 | 11.4 | -1.2 | |
| Majority | 148 | 14.9 | |||
| Turnout | 993 | ||||
| Socialist People's Party gain from Labour | Swing | ||||
| Party | Candidate | Votes | % | ±% | |
|---|---|---|---|---|---|
| Conservative | Shirley Richardson | 780 | 69.3 | +37.8 | |
| Labour | Michelle Roberts | 345 | 30.7 | -5.6 | |
| Majority | 435 | 38.6 | |||
| Turnout | 1,125 | ||||
| Conservative gain from Labour | Swing | ||||
| Party | Candidate | Votes | % | ±% | |
|---|---|---|---|---|---|
| Conservative | Oliver Flitcroft | 390 | 40.2 | +19.9 | |
| Labour | Jean Waiting | 380 | 39.2 | -12.0 | |
| Socialist People's Party | Sarah Martinez | 200 | 20.6 | +2.7 | |
| Majority | 10 | 1.0 | |||
| Turnout | 970 | ||||
| Conservative gain from Labour | Swing | ||||
| Party | Candidate | Votes | % | ±% | |
|---|---|---|---|---|---|
| Conservative | Kenneth Williams | 1,065 | 70.7 | +9.0 | |
| Labour | David McCormick | 442 | 29.3 | -9.0 | |
| Majority | 623 | 41.4 | +18.0 | ||
| Turnout | 1,507 | ||||
| Conservative hold | Swing | ||||
| Party | Candidate | Votes | % | ±% | |
|---|---|---|---|---|---|
| Labour | Anita Husband | 458 | 35.2 | -12.9 | |
| Conservative | Susannah Pearson | 436 | 33.5 | +5.6 | |
| Independent | Stephen Smart | 407 | 31.3 | +7.3 | |
| Majority | 22 | 1.7 | -18.5 | ||
| Turnout | 1,301 | ||||
| Labour hold | Swing | ||||
| Party | Candidate | Votes | % | ±% | |
|---|---|---|---|---|---|
| Conservative | Michael Jones | 641 | |||
| Conservative | Oliver Pearson | 565 | |||
| Labour | Kenneth Beeres | 394 | |||
| Labour | Robert Pointer | 389 | |||
| Independent | Kenneth Arts | 223 | |||
| Turnout | 2,212 | ||||
| Conservative gain from Labour | Swing | ||||
| Conservative gain from Labour | Swing | ||||
References
This article is issued from Wikipedia. The text is licensed under Creative Commons - Attribution - Sharealike. Additional terms may apply for the media files.