1997 Cumbria County Council election
Elections to Cumbria County Council were held on 1 May 1997. This was on the same day as other UK county council elections. The Labour Party gained control of the council, which had been under no overall control.
| |||||||||||||||||||||||||||||||||||||||||||||||||||||
All 83 seats of Cumbria County Council 42 seats needed for a majority | |||||||||||||||||||||||||||||||||||||||||||||||||||||
|---|---|---|---|---|---|---|---|---|---|---|---|---|---|---|---|---|---|---|---|---|---|---|---|---|---|---|---|---|---|---|---|---|---|---|---|---|---|---|---|---|---|---|---|---|---|---|---|---|---|---|---|---|---|
| |||||||||||||||||||||||||||||||||||||||||||||||||||||
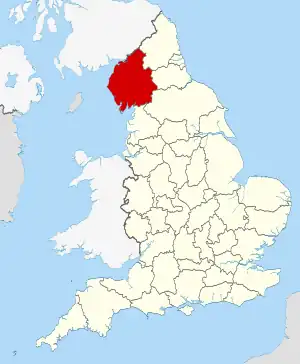 The County of Cumbria within England | |||||||||||||||||||||||||||||||||||||||||||||||||||||
| |||||||||||||||||||||||||||||||||||||||||||||||||||||
Results
| Party | Seats | Gains | Losses | Net gain/loss | Seats % | Votes % | Votes | +/− | |
|---|---|---|---|---|---|---|---|---|---|
| Labour | 44 | 53.0 | 40.4 | 103,969 | |||||
| Conservative | 22 | 26.5 | 36.8 | 94,524 | |||||
| Liberal Democrats | 13 | 15.7 | 19.4 | 49,777 | |||||
| Independent | 4 | 4.8 | 3.0 | 7,619 | |||||
| Liberal | 0 | 0.0 | 0.2 | 551 | |||||
| Green | 0 | 0.0 | 0.2 | 517 | New | ||||
| UKIP | 0 | 0.0 | 0.0 | 89 | New | ||||
References
- "Local Election Summaries 1997". The Elections Centre. Retrieved 15 October 2019.
| County councils |
|
|---|---|
| Unitary authorities |
|
| District councils (England) |
|
| District councils (Northern Ireland) | |
| Sui generis |
|
| Referendums | |
| |
This article is issued from Wikipedia. The text is licensed under Creative Commons - Attribution - Sharealike. Additional terms may apply for the media files.