2003 Copeland Borough Council election
The 2003 Copeland Borough Council election took place on 1 May 2003 to elect members of Copeland Borough Council in Cumbria, England. The whole council was up for election and the Labour Party stayed in overall control of the council.[1]
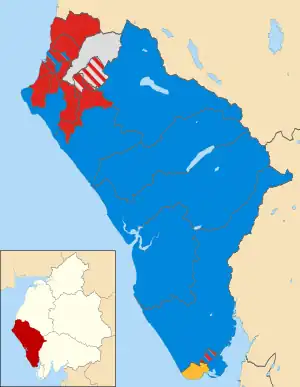
Map of the results of the 2003 Copeland council election. Labour in red, Conservatives in blue, independent in white and Liberal Democrats in yellow.
Election result
| Party | Seats | Gains | Losses | Net gain/loss | Seats % | Votes % | Votes | +/− | |
|---|---|---|---|---|---|---|---|---|---|
| Labour | 31 | +1 | 60.8 | 57.7 | 30,433 | ||||
| Conservative | 16 | -1 | 31.4 | 35.0 | 18,438 | ||||
| Independent | 3 | 0 | 5.9 | 3.7 | 1,962 | ||||
| Liberal Democrats | 1 | 0 | 2.0 | 3.6 | 1,906 | ||||
3 Conservative candidates were unopposed.
Ward results
| Party | Candidate | Votes | % | ±% | |
|---|---|---|---|---|---|
| Independent | Joseph Sunderland | 463 | 71.0 | ||
| Labour | Simon Leyton | 189 | 29.0 | ||
| Majority | 274 | 42.0 | |||
| Turnout | 652 | ||||
| Party | Candidate | Votes | % | ±% | |
|---|---|---|---|---|---|
| Conservative | Yvonne Clarkson | unopposed | |||
| Conservative | John Jackson | unopposed | |||
| Party | Candidate | Votes | % | ±% | |
|---|---|---|---|---|---|
| Conservative | Keith Hitchen | 502 | 68.6 | ||
| Liberal Democrats | Roger Putnam | 230 | 31.4 | ||
| Majority | 272 | 37.2 | |||
| Turnout | 732 | ||||
| Party | Candidate | Votes | % | ±% | |
|---|---|---|---|---|---|
| Conservative | Dorothy Wonnacott | 924 | |||
| Labour | James Hewitson | 839 | |||
| Labour | Anthony Johnston | 829 | |||
| Conservative | Mark Mallard | 812 | |||
| Labour | Edward Brenan | 798 | |||
| Conservative | Allan Mossop | 752 | |||
| Turnout | 4,954 | ||||
| Party | Candidate | Votes | % | ±% | |
|---|---|---|---|---|---|
| Independent | Anthony Wells | 616 | |||
| Labour | Joan Hully | 538 | |||
| Labour | William Southward | 511 | |||
| Labour | John Henney | 445 | |||
| Turnout | 2,110 | ||||
| Party | Candidate | Votes | % | ±% | |
|---|---|---|---|---|---|
| Labour | Catherine Giel | 679 | |||
| Labour | David Banks | 652 | |||
| Conservative | Hilda Morris | 194 | |||
| Liberal Democrats | Mike Minogue | 192 | |||
| Liberal Democrats | Stuart Bowers | 180 | |||
| Turnout | 1,897 | ||||
| Party | Candidate | Votes | % | ±% | |
|---|---|---|---|---|---|
| Labour | Willis Metherell | 992 | |||
| Labour | Brian Dixon | 963 | |||
| Labour | Kevin Young | 952 | |||
| Liberal Democrats | Frank Hollowell | 441 | |||
| Liberal Democrats | Mary Lancaster | 349 | |||
| Conservative | Joyce Toft | 231 | |||
| Liberal Democrats | Stephen Litt | 197 | |||
| Turnout | 4,125 | ||||
| Party | Candidate | Votes | % | ±% | |
|---|---|---|---|---|---|
| Labour | Samuel Meteer | 975 | |||
| Labour | Elaine Woodburn | 936 | |||
| Labour | Margaret Woodburn | 933 | |||
| Conservative | Steven Hill | 536 | |||
| Conservative | Alfred Bailey | 402 | |||
| Conservative | Elizabeth Hutson | 402 | |||
| Turnout | 4,184 | ||||
| Party | Candidate | Votes | % | ±% | |
|---|---|---|---|---|---|
| Labour | Michael McVeigh | 1,184 | |||
| Labour | Peter Watson | 1,043 | |||
| Labour | Constance Watson | 1,005 | |||
| Conservative | John Holmes | 592 | |||
| Conservative | Jean Lewthwaite | 572 | |||
| Conservative | Frederick Blinco | 537 | |||
| Turnout | 4,933 | ||||
| Party | Candidate | Votes | % | ±% | |
|---|---|---|---|---|---|
| Conservative | Robert Salkeld | 327 | 68.7 | ||
| Labour | Mary Ross | 149 | 31.3 | ||
| Majority | 178 | 37.4 | |||
| Turnout | 476 | ||||
| Party | Candidate | Votes | % | ±% | |
|---|---|---|---|---|---|
| Labour | Peter Connolly | 616 | |||
| Independent | James Close | 592 | |||
| Labour | Timothy Knowles | 425 | |||
| Turnout | 1,633 | ||||
| Party | Candidate | Votes | % | ±% | |
|---|---|---|---|---|---|
| Conservative | David Gray | 563 | 71.9 | ||
| Labour | Christina Cornall | 220 | 28.1 | ||
| Majority | 343 | 43.8 | |||
| Turnout | 783 | ||||
| Party | Candidate | Votes | % | ±% | |
|---|---|---|---|---|---|
| Labour | Janet Johnston | 987 | |||
| Labour | Henry Wormstrup | 944 | |||
| Labour | Paul Whalley | 901 | |||
| Conservative | Marcus Swift | 589 | |||
| Conservative | David Hall | 572 | |||
| Turnout | 3,993 | ||||
| Party | Candidate | Votes | % | ±% | |
|---|---|---|---|---|---|
| Liberal Democrats | Margaret Barnes | 317 | 50.6 | ||
| Conservative | Francis Cairns | 309 | 49.4 | ||
| Majority | 8 | 1.3 | |||
| Turnout | 626 | ||||
| Party | Candidate | Votes | % | ±% | |
|---|---|---|---|---|---|
| Labour | Norman Williams | 1,104 | |||
| Labour | Jamieson Reed | 970 | |||
| Labour | Margarita Docherty | 859 | |||
| Conservative | Gareth Maley | 436 | |||
| Turnout | 3,369 | ||||
| Party | Candidate | Votes | % | ±% | |
|---|---|---|---|---|---|
| Conservative | Alistair Norwood | 828 | |||
| Conservative | Andrew Wonnacott | 728 | |||
| Labour | John Woolley | 415 | |||
| Turnout | 1,971 | ||||
| Party | Candidate | Votes | % | ±% | |
|---|---|---|---|---|---|
| Labour | John Park | 683 | 38.9 | ||
| Conservative | Frederick Gleaves | 665 | 37.9 | ||
| Conservative | Alan Altree | 407 | 23.2 | ||
| Turnout | 1,755 | ||||
| Party | Candidate | Votes | % | ±% | |
|---|---|---|---|---|---|
| Labour | George Clements | 791 | |||
| Labour | Alan Holliday | 661 | |||
| Conservative | Leah Higgins | 262 | |||
| Turnout | 1,714 | ||||
| Party | Candidate | Votes | % | ±% | |
|---|---|---|---|---|---|
| Conservative | Gilbert Scurrah | unopposed | |||
| Party | Candidate | Votes | % | ±% | |
|---|---|---|---|---|---|
| Labour | Dorothy Faichney | 1,320 | |||
| Labour | Robert Docherty | 1,132 | |||
| Labour | Michael Ashbrook | 875 | |||
| Conservative | George Higgins | 305 | |||
| Conservative | Dorothy Gray | 204 | |||
| Turnout | 3,836 | ||||
| Party | Candidate | Votes | % | ±% | |
|---|---|---|---|---|---|
| Labour | Geoffrey Blackwell | 343 | 54.9 | ||
| Conservative | Edward Fox | 282 | 45.1 | ||
| Majority | 61 | 9.8 | |||
| Turnout | 625 | ||||
| Party | Candidate | Votes | % | ±% | |
|---|---|---|---|---|---|
| Conservative | Francis McPhillips | 905 | |||
| Conservative | Francis Heathcote | 898 | |||
| Conservative | Raymond Cole | 872 | |||
| Labour | Gavin Towers | 591 | |||
| Labour | Keith Crellin | 502 | |||
| Turnout | 3,768 | ||||
| Party | Candidate | Votes | % | ±% | |
|---|---|---|---|---|---|
| Conservative | Norman Clarkson | 575 | 74.6 | ||
| Labour | Archibald Ross | 196 | 25.4 | ||
| Majority | 379 | 49.2 | |||
| Turnout | 771 | ||||
| Party | Candidate | Votes | % | ±% | |
|---|---|---|---|---|---|
| Labour | Peter Tyson | 536 | |||
| Labour | James Prince | 360 | |||
| Independent | Gordon Brown | 291 | |||
| Conservative | Sheena Gray | 146 | |||
| Turnout | 1,333 | ||||
| Party | Candidate | Votes | % | ±% | |
|---|---|---|---|---|---|
| Conservative | David Moore | 1,147 | |||
| Conservative | Eileen Eastwood | 962 | |||
| Labour | Charles Tuley | 390 | |||
| Turnout | 2,499 | ||||
References
- "Local elections". BBC News Online. Retrieved 24 July 2011.
- "21.4 Copeland". Local Elections Archive Project. Retrieved 24 July 2011.
- "Local council election results". The Daily Telegraph. 3 May 2003. Retrieved 24 July 2011.
This article is issued from Wikipedia. The text is licensed under Creative Commons - Attribution - Sharealike. Additional terms may apply for the media files.