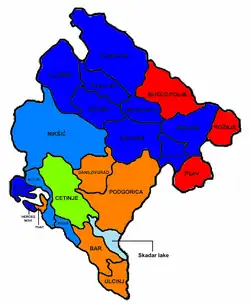
2001 Montenegrin parliamentary election
Parliamentary elections were held in Montenegro on 22 April 2001. The result was a victory for the Victory is of Montenegro alliance formed by the Democratic Party of Socialists of Montenegro and the Social Democratic Party of Montenegro, which won 36 of the 77 seats.
| ||||||||||||||||||||||||||||||||||||
| ||||||||||||||||||||||||||||||||||||
Electoral system
Of the 77 seats in Parliament, 72 were elected by proportional representation in a nationwide constituency and five were elected in a special constituency for the Albanian minority. The electoral threshold was set at 3% and seats allocated using the d'Hondt method. Closed lists were used with a single list for both constituencies, although parties only had to award half their seats according to the order of the list, with the remaining half free for them to allocate.
Contesting parties
Victory is of Montenegro
The coalition lost parliamentary majority, winning just 36 of 77 seats (30 for DPS and 6 for SDP). Contrary to everyone's expectation, the now opposing, once former ally, Liberal Alliance supported it to form a minority government under Filip Vujanović. But closer aligning of LSCG with the Together for Yugoslavia bloc distanced it from the minority coalition. The government signed the Belgrade Agreement in 2002, by which the Federal Republic of Yugoslavia was transformed into the State Union of Serbia and Montenegro, and the Republic of Montenegro re-integrated into political structure with Serbia.
Together for Yugoslavia
The Socialist People's Party of Montenegro received 21 seat, People's Party of Montenegro got 9 and the Serbian People's Party of Montenegro 3. The coalition won these elections and had support of the majority of the Parliament, but inner conflicts and organized obstruction from the opposition under Milo Djukanovic, prevented it from succeeding in forming the government which was supposed to be led by Prime Minister candidate Predrag Bulatović. The deadline passed an Predrag reformed a more organized and stronger coalition determined to repeat the election in 2002, however disappointment returned Milo Đukanović's DPS CG to power which won the election.
Liberal Alliance of Montenegro
At the election, LSCG received a larger number of votes: 7,85% (almost 28.000 votes), winning 6 seats in the Assembly. Due do the political deadlock, in which no party had won absolute power, LSCG made an agreement with DPS to support the minority government, following a pledge from DPS that within a year a referendum on independence will have been held. However, LSCG still retained the resolute opposition attitude, and withdrew support to the minority government due to the fact that the referendum has not been announced in the promised period.
Results
| Party | Votes | % | Seats | |||||
|---|---|---|---|---|---|---|---|---|
| General | Albanian | Total | +/– | |||||
| Victory is Montenegro's | 153,946 | 42.36 | 33 | 3 | 36 | −1 | ||
| Together for Yugoslavia | 148,513 | 40.87 | 33 | 0 | 33 | −1 | ||
| Liberal Alliance of Montenegro | 28,746 | 7.91 | 6 | 0 | 6 | +1 | ||
| People's Socialist Party of Montenegro | 10,702 | 2.94 | 0 | 0 | 0 | New | ||
| Serbian Radical Party | 4,275 | 1.18 | 0 | 0 | 0 | 0 | ||
| Democratic Union of Albanians | 4,232 | 1.16 | 0 | 1 | 1 | 0 | ||
| Bosniak-Muslim Coalition | 4,046 | 1.11 | 0 | 0 | 0 | New | ||
| Democratic League in Montenegro | 3,570 | 0.98 | 0 | 1 | 1 | 0 | ||
| Communist and Workers' Parties | 1,640 | 0.45 | 0 | 0 | 0 | 0 | ||
| Party of Democratic Prosperity | 1,572 | 0.43 | 0 | 0 | 0 | New | ||
| Party of Foreign Currency Savers | 639 | 0.18 | 0 | 0 | 0 | 0 | ||
| Natural Law Party of Montenegro | 512 | 0.14 | 0 | 0 | 0 | 0 | ||
| Liberal Democratic Party | 354 | 0.10 | 0 | 0 | 0 | New | ||
| People's Concord of Montenegro | 268 | 0.07 | 0 | 0 | 0 | New | ||
| Party of Savings and Social Security | 199 | 0.05 | 0 | 0 | 0 | 0 | ||
| Yugoslav Left in Montenegro | 190 | 0.05 | 0 | 0 | 0 | 0 | ||
| Total | 363,404 | 100.00 | 72 | 5 | 77 | −1 | ||
| Valid votes | 363,404 | 99.25 | ||||||
| Invalid/blank votes | 2,748 | 0.75 | ||||||
| Total votes | 366,152 | 100.00 | ||||||
| Registered voters/turnout | 447,673 | 81.79 | ||||||
| Source: Slavic-Eurasian Research Centre | ||||||||
