1988 City of Edinburgh District Council election
Elections for the City of Edinburgh District Council took place on Thursday 5 May 1988, alongside elections to the councils of Scotland's various other districts.
| |||||||||||||||||||||||||||||||||||||||||||||||||||||
All 62 seats to Edinburgh City Council 32 seats needed for a majority | |||||||||||||||||||||||||||||||||||||||||||||||||||||
|---|---|---|---|---|---|---|---|---|---|---|---|---|---|---|---|---|---|---|---|---|---|---|---|---|---|---|---|---|---|---|---|---|---|---|---|---|---|---|---|---|---|---|---|---|---|---|---|---|---|---|---|---|---|
| |||||||||||||||||||||||||||||||||||||||||||||||||||||
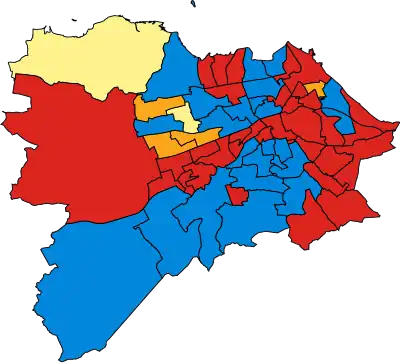 Map of council wards | |||||||||||||||||||||||||||||||||||||||||||||||||||||
| |||||||||||||||||||||||||||||||||||||||||||||||||||||
Labour had won control of the Council for the first time ever in the previous elections, and managed to retain its control. Voter turnout was 53.2%, up from 47.6% in the previous elections.[1]
Aggregate results
| Party | Seats | Gains | Losses | Net gain/loss | Seats % | Votes % | Votes | +/− | |
|---|---|---|---|---|---|---|---|---|---|
| Labour | 33 | 36.6 | 70,491 | ||||||
| Conservative | 23 | 36.6 | 70,561 | ||||||
| SLD | 4 | 12.2 | 23,422 | ||||||
| SNP | 2 | 14.1 | 27,162 | ||||||
| SDP | 0 | 0.3 | 578 | New | |||||
| Independent | 0 | 0 | 1 | 0.1 | 30 | ||||
| Other parties | 0 | 0.4 | 727 | ||||||
References
- "District Council Elections: Key Councils - How the Parties Polled". The Glasgow Herald. 7 May 1988. p. 6.
- p.83-87
- "District Council Elections: Key Councils - How the Parties Polled". The Glasgow Herald. 6 May 1988. p. 10.
| Edinburgh Corporation |
|
|---|---|
| City of Edinburgh District Council | |
| Lothian Regional Council | |
| City of Edinburgh Council | |
| Referendums | |
| Metropolitan boroughs |
|
|---|---|
| District councils (England) |
|
| District councils (Scotland) |
|
This article is issued from Wikipedia. The text is licensed under Creative Commons - Attribution - Sharealike. Additional terms may apply for the media files.