1984 United States presidential election in Mississippi
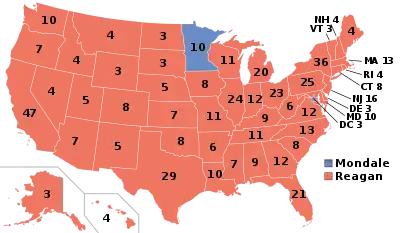
The 1984 United States presidential election in Mississippi took place on November 6, 1984. All fifty states and the District of Columbia, were part of the 1984 United States presidential election. Mississippi voters chose seven electors to the Electoral College, which selected the president and vice president of the United States.
| ||||||||||||||||||||||||||
| ||||||||||||||||||||||||||
 
| ||||||||||||||||||||||||||
| ||||||||||||||||||||||||||
Mississippi was won by incumbent United States President Ronald Reagan of California, who was running against former Vice President Walter Mondale of Minnesota. Reagan ran for a second time with former C.I.A. Director George H. W. Bush of Texas, and Mondale ran with Representative Geraldine Ferraro of New York, the first major female candidate for the vice presidency.
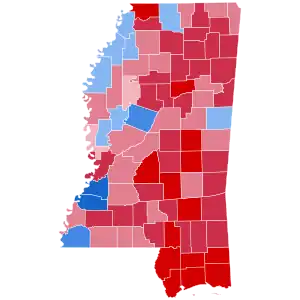
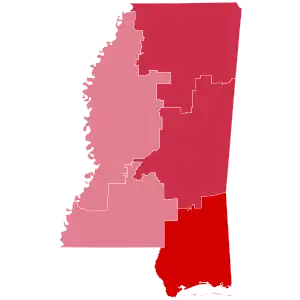
All but two counties gave either Mondale or Reagan an outright majority; Leflore and Issaquena Counties gave Reagan a plurality. Reagan's best county was Lamar, where he got 79.9% of the vote; Mondale's was Jefferson, where he got 77.9%. Despite Reagan's overall landslide win in the state, Jefferson County, which possessed the largest African-American share of United States county's population, gave Mondale his fourth-largest vote share of any county or county-equivalent, after the District of Columbia, Macon County, Alabama, and majority-Native American Shannon County, South Dakota.[1]
As of the 2020 presidential election, this is the last election in which the following counties voted for a Republican presidential candidate: Clay, Issaquena, Jefferson Davis, Sunflower, and Tallahatchie.[2] This marked the first time in history that Mississippi voted Republican in consecutive elections (or that a Republican carried the state twice), and the first such occasion for any party since 1956.
79% of white voters supported Reagan while 20% supported Mondale.[3][4]

Results
| 1984 United States presidential election in Mississippi | |||||
|---|---|---|---|---|---|
| Party | Candidate | Votes | Percentage | Electoral votes | |
| Republican | Ronald Reagan (incumbent) | 581,477 | 61.85% | 7 | |
| Democratic | Walter Mondale | 352,192 | 37.46% | 0 | |
| Libertarian | David Bergland | 2,336 | 0.25% | 0 | |
| Workers World | Larry Holmes | 1,169 | 0.12% | 0 | |
| Socialist Workers Party | Melvin Mason | 1,032 | 0.11% | 0 | |
| Independent | Lyndon LaRouche | 1,001 | 0.11% | 0 | |
| America First | Bob Richards | 629 | 0.07% | 0 | |
| New Alliance Party | Dennis Serrette | 356 | 0.04% | 0 | |
| Totals | 940,192 | 100.0% | 7 | ||
Results by county
| County | Ronald Wilson Reagan Republican |
Walter Frederick Mondale Democratic |
Various candidates Other parties |
Margin | Total votes cast | ||||
|---|---|---|---|---|---|---|---|---|---|
| # | % | # | % | # | % | # | % | ||
| Adams | 9,440 | 54.32% | 7,849 | 45.17% | 89 | 0.51% | 1,591 | 9.16% | 17,378 |
| Alcorn | 7,203 | 58.66% | 4,862 | 39.60% | 214 | 1.74% | 2,341 | 19.07% | 12,279 |
| Amite | 3,463 | 57.24% | 2,569 | 42.46% | 18 | 0.30% | 894 | 14.78% | 6,050 |
| Attala | 4,870 | 59.28% | 3,327 | 40.50% | 18 | 0.22% | 1,543 | 18.78% | 8,215 |
| Benton | 1,737 | 50.12% | 1,715 | 49.48% | 14 | 0.40% | 22 | 0.63% | 3,466 |
| Bolivar | 6,939 | 43.85% | 8,769 | 55.42% | 116 | 0.73% | -1,830 | -11.56% | 15,824 |
| Calhoun | 3,579 | 67.06% | 1,749 | 32.77% | 9 | 0.17% | 1,830 | 34.29% | 5,337 |
| Carroll | 2,823 | 65.70% | 1,462 | 34.02% | 12 | 0.28% | 1,361 | 31.67% | 4,297 |
| Chickasaw | 3,605 | 60.52% | 2,329 | 39.10% | 23 | 0.39% | 1,276 | 21.42% | 5,957 |
| Choctaw | 2,491 | 68.00% | 1,166 | 31.83% | 6 | 0.16% | 1,325 | 36.17% | 3,663 |
| Claiborne | 1,294 | 28.86% | 3,179 | 70.90% | 11 | 0.25% | -1,885 | -42.04% | 4,484 |
| Clarke | 4,551 | 66.61% | 2,262 | 33.11% | 19 | 0.28% | 2,289 | 33.50% | 6,832 |
| Clay | 4,112 | 50.23% | 4,046 | 49.42% | 29 | 0.35% | 66 | 0.81% | 8,187 |
| Coahoma | 5,759 | 44.96% | 6,839 | 53.39% | 212 | 1.65% | -1,080 | -8.43% | 12,810 |
| Copiah | 5,806 | 55.74% | 4,591 | 44.08% | 19 | 0.18% | 1,215 | 11.66% | 10,416 |
| Covington | 4,165 | 64.95% | 2,219 | 34.60% | 29 | 0.45% | 1,946 | 30.34% | 6,413 |
| DeSoto | 12,576 | 73.88% | 4,369 | 25.67% | 77 | 0.45% | 8,207 | 48.21% | 17,022 |
| Forrest | 15,719 | 69.63% | 6,786 | 30.06% | 71 | 0.31% | 8,933 | 39.57% | 22,576 |
| Franklin | 2,564 | 62.86% | 1,494 | 36.63% | 21 | 0.51% | 1,070 | 26.23% | 4,079 |
| George | 4,346 | 72.10% | 1,655 | 27.46% | 27 | 0.45% | 2,691 | 44.64% | 6,028 |
| Greene | 2,744 | 67.55% | 1,297 | 31.93% | 21 | 0.52% | 1,447 | 35.62% | 4,062 |
| Grenada | 5,181 | 60.80% | 3,325 | 39.02% | 15 | 0.18% | 1,856 | 21.78% | 8,521 |
| Hancock | 7,662 | 74.07% | 2,630 | 25.43% | 52 | 0.50% | 5,032 | 48.65% | 10,344 |
| Harrison | 33,995 | 72.83% | 12,495 | 26.77% | 187 | 0.40% | 21,500 | 46.06% | 46,677 |
| Hinds | 56,953 | 56.69% | 42,373 | 42.18% | 1,142 | 1.14% | 14,580 | 14.51% | 100,468 |
| Holmes | 3,102 | 35.44% | 5,641 | 64.45% | 10 | 0.11% | -2,539 | -29.01% | 8,753 |
| Humphreys | 2,309 | 46.99% | 2,596 | 52.83% | 9 | 0.18% | -287 | -5.84% | 4,914 |
| Issaquena | 512 | 49.52% | 501 | 48.45% | 21 | 2.03% | 11 | 1.06% | 1,034 |
| Itawamba | 4,587 | 62.96% | 2,674 | 36.71% | 24 | 0.33% | 1,913 | 26.26% | 7,285 |
| Jackson | 29,585 | 76.79% | 8,821 | 22.89% | 123 | 0.32% | 20,764 | 53.89% | 38,529 |
| Jasper | 3,727 | 54.00% | 3,104 | 44.97% | 71 | 1.03% | 623 | 9.03% | 6,902 |
| Jefferson | 856 | 21.88% | 3,049 | 77.94% | 7 | 0.18% | -2,193 | -56.06% | 3,912 |
| Jefferson Davis | 2,884 | 51.81% | 2,644 | 47.50% | 38 | 0.68% | 240 | 4.31% | 5,566 |
| Jones | 17,586 | 70.47% | 7,298 | 29.25% | 70 | 0.28% | 10,288 | 41.23% | 24,954 |
| Kemper | 2,354 | 52.83% | 2,089 | 46.88% | 13 | 0.29% | 265 | 5.95% | 4,456 |
| Lafayette | 6,006 | 62.05% | 3,646 | 37.67% | 28 | 0.29% | 2,360 | 24.38% | 9,680 |
| Lamar | 7,929 | 79.85% | 1,964 | 19.78% | 37 | 0.37% | 5,965 | 60.07% | 9,930 |
| Lauderdale | 18,807 | 69.00% | 7,534 | 27.64% | 916 | 3.36% | 11,273 | 41.36% | 27,257 |
| Lawrence | 3,970 | 63.49% | 2,274 | 36.37% | 9 | 0.14% | 1,696 | 27.12% | 6,253 |
| Leake | 4,663 | 62.04% | 2,845 | 37.85% | 8 | 0.11% | 1,818 | 24.19% | 7,516 |
| Lee | 13,312 | 67.47% | 6,208 | 31.46% | 210 | 1.06% | 7,104 | 36.01% | 19,730 |
| Leflore | 7,550 | 49.63% | 7,443 | 48.93% | 219 | 1.44% | 107 | 0.70% | 15,212 |
| Lincoln | 8,898 | 66.50% | 4,458 | 33.32% | 25 | 0.19% | 4,440 | 33.18% | 13,381 |
| Lowndes | 12,049 | 66.29% | 6,078 | 33.44% | 50 | 0.28% | 5,971 | 32.85% | 18,177 |
| Madison | 9,298 | 53.24% | 8,002 | 45.82% | 163 | 0.93% | 1,296 | 7.42% | 17,463 |
| Marion | 7,355 | 66.11% | 3,757 | 33.77% | 13 | 0.12% | 3,598 | 32.34% | 11,125 |
| Marshall | 4,389 | 42.70% | 5,845 | 56.87% | 44 | 0.43% | -1,456 | -14.17% | 10,278 |
| Monroe | 7,387 | 62.28% | 4,437 | 37.41% | 36 | 0.30% | 2,950 | 24.87% | 11,860 |
| Montgomery | 3,093 | 62.07% | 1,881 | 37.75% | 9 | 0.18% | 1,212 | 24.32% | 4,983 |
| Neshoba | 6,715 | 71.71% | 2,630 | 28.09% | 19 | 0.20% | 4,085 | 43.62% | 9,364 |
| Newton | 5,911 | 73.23% | 2,127 | 26.35% | 34 | 0.42% | 3,784 | 46.88% | 8,072 |
| Noxubee | 2,123 | 41.23% | 2,928 | 56.87% | 98 | 1.90% | -805 | -15.63% | 5,149 |
| Oktibbeha | 7,574 | 59.65% | 5,097 | 40.14% | 26 | 0.20% | 2,477 | 19.51% | 12,697 |
| Panola | 5,850 | 51.43% | 5,465 | 48.04% | 60 | 0.53% | 385 | 3.38% | 11,375 |
| Pearl River | 9,978 | 76.10% | 3,085 | 23.53% | 49 | 0.37% | 6,893 | 52.57% | 13,112 |
| Perry | 3,098 | 65.30% | 1,415 | 29.83% | 231 | 4.87% | 1,683 | 35.48% | 4,744 |
| Pike | 8,254 | 57.28% | 6,137 | 42.59% | 20 | 0.14% | 2,117 | 14.69% | 14,411 |
| Pontotoc | 5,182 | 67.80% | 2,434 | 31.85% | 27 | 0.35% | 2,748 | 35.95% | 7,643 |
| Prentiss | 4,821 | 62.35% | 2,897 | 37.47% | 14 | 0.18% | 1,924 | 24.88% | 7,732 |
| Quitman | 2,198 | 48.33% | 2,343 | 51.52% | 7 | 0.15% | -145 | -3.19% | 4,548 |
| Rankin | 22,393 | 79.10% | 5,874 | 20.75% | 41 | 0.14% | 16,519 | 58.35% | 28,308 |
| Scott | 5,763 | 63.66% | 3,274 | 36.16% | 16 | 0.18% | 2,489 | 27.49% | 9,053 |
| Sharkey | 1,487 | 43.76% | 1,723 | 50.71% | 188 | 5.53% | -236 | -6.95% | 3,398 |
| Simpson | 5,983 | 67.04% | 2,894 | 32.43% | 47 | 0.53% | 3,089 | 34.61% | 8,924 |
| Smith | 5,116 | 76.24% | 1,573 | 23.44% | 21 | 0.31% | 3,543 | 52.80% | 6,710 |
| Stone | 2,980 | 71.07% | 1,185 | 28.26% | 28 | 0.67% | 1,795 | 42.81% | 4,193 |
| Sunflower | 5,178 | 51.21% | 4,913 | 48.59% | 20 | 0.20% | 265 | 2.62% | 10,111 |
| Tallahatchie | 2,901 | 51.38% | 2,725 | 48.26% | 20 | 0.35% | 176 | 3.12% | 5,646 |
| Tate | 4,677 | 61.89% | 2,846 | 37.66% | 34 | 0.45% | 1,831 | 24.23% | 7,557 |
| Tippah | 4,706 | 64.46% | 2,566 | 35.15% | 29 | 0.40% | 2,140 | 29.31% | 7,301 |
| Tishomingo | 3,527 | 54.87% | 2,879 | 44.79% | 22 | 0.34% | 648 | 10.08% | 6,428 |
| Tunica | 1,109 | 39.55% | 1,621 | 57.81% | 74 | 2.64% | -512 | -18.26% | 2,804 |
| Union | 5,837 | 67.74% | 2,766 | 32.10% | 14 | 0.16% | 3,071 | 35.64% | 8,617 |
| Walthall | 3,305 | 59.65% | 2,219 | 40.05% | 17 | 0.31% | 1,086 | 19.60% | 5,541 |
| Warren | 12,959 | 60.99% | 8,054 | 37.90% | 235 | 1.11% | 4,905 | 23.08% | 21,248 |
| Washington | 12,454 | 53.19% | 10,617 | 45.34% | 343 | 1.46% | 1,837 | 7.85% | 23,414 |
| Wayne | 5,000 | 63.81% | 2,818 | 35.96% | 18 | 0.23% | 2,182 | 27.85% | 7,836 |
| Webster | 3,390 | 70.71% | 1,397 | 29.14% | 7 | 0.15% | 1,993 | 41.57% | 4,794 |
| Wilkinson | 1,722 | 39.28% | 2,627 | 59.92% | 35 | 0.80% | -905 | -20.64% | 4,384 |
| Winston | 5,192 | 59.36% | 3,543 | 40.51% | 11 | 0.13% | 1,649 | 18.85% | 8,746 |
| Yalobusha | 2,934 | 55.52% | 2,337 | 44.22% | 14 | 0.26% | 597 | 11.30% | 5,285 |
| Yazoo | 6,275 | 54.99% | 5,037 | 44.14% | 100 | 0.88% | 1,238 | 10.85% | 11,412 |
| Totals | 582,377 | 61.88% | 352,192 | 37.42% | 6,523 | 0.69% | 230,185 | 24.46% | 941,092 |
See also
References
- Dave Leip's Atlas of U.S. Presidential Elections; 1984 Presidential Election Statistics
- Sullivan, Robert David; ‘How the Red and Blue Map Evolved Over the Past Century’; America Magazine in The National Catholic Review; June 29, 2016
- Black & Black 1992, p. 295.
- Black & Black 1992, p. 335.
Works cited
- Black, Earl; Black, Merle (1992). The Vital South: How Presidents Are Elected. Harvard University Press. ISBN 0674941306.
.jpg.webp)
.jpg.webp)
