1973 Bristol City Council election
The 1973 Bristol City Council election took place on 7 June 1973 to elect members of Bristol City Council in England.[1] This was on the same day as other local elections. Voting took place across 28 wards, each electing 3 Councillors. Following the Local Government Act 1972, this was the first election to the new non-metropolitan district council for Bristol, which came into being on 1 April the following year. Labour took control of the Council after winning a comfortable majority of seats.
| |||||||||||||
All 84 seats to Bristol City Council 43 seats needed for a majority | |||||||||||||
|---|---|---|---|---|---|---|---|---|---|---|---|---|---|
| |||||||||||||
| |||||||||||||
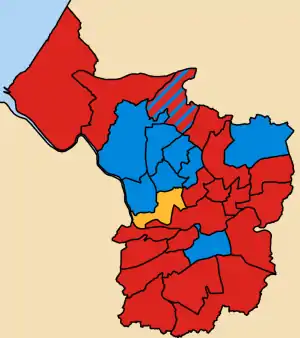
1973 local election results in Bristol
The National Front stood in four wards in this election[2]
Ward results
Avon
| Party | Candidate | Votes | % | ±% | |
|---|---|---|---|---|---|
| Labour | V Pople | 2,786 | |||
| Labour | J Ellis | 2,684 | |||
| Labour | J Britton | 2,459 | |||
| Conservative | R Banfield | 1,025 | |||
| Conservative | J Henley | 961 | |||
| Conservative | J Taylor | 948 | |||
| Communist | D Pratt | 266 | |||
| Majority | |||||
| Labour win (new seat) | |||||
| Labour win (new seat) | |||||
| Labour win (new seat) | |||||
Bedminster
| Party | Candidate | Votes | % | ±% | |
|---|---|---|---|---|---|
| Labour | A Hillman | 1,322 | |||
| Labour | J Wood | 1,174 | |||
| Labour | H McKay | 1,120 | |||
| Independent | M Bidgood | 996 | |||
| Conservative | I Gillard | 652 | |||
| Conservative | C Taylor | 636 | |||
| Conservative | I Dawson | 620 | |||
| Independent | J Rowe | 459 | |||
| Independent | N Juliff | 453 | |||
| National Front | D Hales | 266 | |||
| Majority | |||||
| Labour win (new seat) | |||||
| Labour win (new seat) | |||||
| Labour win (new seat) | |||||
Bishopston
| Party | Candidate | Votes | % | ±% | |
|---|---|---|---|---|---|
| Conservative | D Topham | 1,626 | |||
| Conservative | T Clarke | 1,525 | |||
| Conservative | M Withers | 1,518 | |||
| Liberal | K Tucker | 723 | |||
| Liberal | A Cook | 658 | |||
| Labour | S Cullard | 613 | |||
| Labour | P McLaren | 606 | |||
| Liberal | D Burrows | 602 | |||
| Labour | M Wood | 565 | |||
| Majority | |||||
| Conservative win (new seat) | |||||
| Conservative win (new seat) | |||||
| Conservative win (new seat) | |||||
Bishopsworth
| Party | Candidate | Votes | % | ±% | |
|---|---|---|---|---|---|
| Labour | L Smith | 1,938 | |||
| Labour | R Morris | 1,872 | |||
| Labour | A Munroe | 1,842 | |||
| Independent | D Street | 855 | |||
| Independent | R Rowe | 819 | |||
| Independent | S Juliffe | 733 | |||
| Communist | B Poole | 153 | |||
| Communist | D Watson | 128 | |||
| Majority | |||||
| Labour win (new seat) | |||||
| Labour win (new seat) | |||||
| Labour win (new seat) | |||||
Brislington
| Party | Candidate | Votes | % | ±% | |
|---|---|---|---|---|---|
| Labour | K Legg | 1,919 | |||
| Labour | H Skeates | 1,781 | |||
| Labour | G Holmes | 1,779 | |||
| Conservative | O Scantlebury | 1,604 | |||
| Conservative | T Bray | 1,593 | |||
| Conservative | P Elliott | 1,465 | |||
| Majority | |||||
| Labour win (new seat) | |||||
| Labour win (new seat) | |||||
| Labour win (new seat) | |||||
Cabot
| Party | Candidate | Votes | % | ±% | |
|---|---|---|---|---|---|
| Liberal | G Ferguson | 1,075 | |||
| Liberal | W Watts-Miller | 1,036 | |||
| Liberal | G Beedell | 1,034 | |||
| Labour | F Brown | 883 | |||
| Conservative | P Maggs | 834 | |||
| Conservative | P Patemoster | 792 | |||
| Conservative | G Woodhouse | 756 | |||
| Labour | A Kimpton | 703 | |||
| Labour | E Malos | 696 | |||
| Majority | |||||
| Liberal win (new seat) | |||||
| Liberal win (new seat) | |||||
| Liberal win (new seat) | |||||
Clifton
| Party | Candidate | Votes | % | ±% | |
|---|---|---|---|---|---|
| Conservative | J Lloyd-Kirk | 1,623 | |||
| Conservative | T Girling | 1,601 | |||
| Conservative | H Lawson | 1,571 | |||
| Liberal | A Hodges | 716 | |||
| Liberal | M Perkins | 689 | |||
| Labour | F Inglis | 684 | |||
| Labour | J Donovan | 643 | |||
| Labour | M Thomas | 511 | |||
| Communist | M Beardon | 184 | |||
| Majority | |||||
| Conservative win (new seat) | |||||
| Conservative win (new seat) | |||||
| Conservative win (new seat) | |||||
District
| Party | Candidate | Votes | % | ±% | |
|---|---|---|---|---|---|
| Conservative | F Apperley | 1,462 | |||
| Conservative | J Bosdet | 1,456 | |||
| Conservative | R Trench | 1,447 | |||
| Labour | J Malos | 1,094 | |||
| Labour | P Phillips | 1,087 | |||
| Labour | G Micklewright | 1,063 | |||
| Majority | |||||
| Conservative win (new seat) | |||||
| Conservative win (new seat) | |||||
| Conservative win (new seat) | |||||
Durdham
| Party | Candidate | Votes | % | ±% | |
|---|---|---|---|---|---|
| Conservative | G Palmer | 2,650 | |||
| Conservative | G Browne | 2,525 | |||
| Conservative | P Berrill | 2,473 | |||
| Liberal | G Beddoes | 958 | |||
| Liberal | E Mallett | 876 | |||
| Labour | D Blackman | 591 | |||
| Labour | E Holland | 575 | |||
| Labour | M Smith | 526 | |||
| Majority | |||||
| Conservative win (new seat) | |||||
| Conservative win (new seat) | |||||
| Conservative win (new seat) | |||||
Easton
| Party | Candidate | Votes | % | ±% | |
|---|---|---|---|---|---|
| Labour | J Jones | 1,205 | |||
| Labour | G Maggs | 1,183 | |||
| Labour | W Jenkins | 1,076 | |||
| Conservative | S Russell | 341 | |||
| Communist | N Carey | 135 | |||
| Majority | |||||
| Labour win (new seat) | |||||
| Labour win (new seat) | |||||
| Labour win (new seat) | |||||
Eastville
| Party | Candidate | Votes | % | ±% | |
|---|---|---|---|---|---|
| Labour | E Fothergill | 1,561 | |||
| Labour | W Williams | 1,560 | |||
| Labour | B Ross | 1,451 | |||
| Conservative | E Macdonald | 918 | |||
| Conservative | A Thomas | 905 | |||
| Conservative | M Bessant | 857 | |||
| Liberal | A Chalmers | 807 | |||
| Liberal | S Clements | 618 | |||
| Liberal | B Payton | 572 | |||
| Majority | |||||
| Labour win (new seat) | |||||
| Labour win (new seat) | |||||
| Labour win (new seat) | |||||
Henbury
| Party | Candidate | Votes | % | ±% | |
|---|---|---|---|---|---|
| Labour | J Fisk | 2,989 | |||
| Labour | D Large | 2,762 | |||
| Labour | G Brass | 2,664 | |||
| Conservative | D Evans | 2,480 | |||
| Conservative | W Lippiatt | 2,456 | |||
| Conservative | R Biggs | 2,396 | |||
| Majority | |||||
| Labour win (new seat) | |||||
| Labour win (new seat) | |||||
| Labour win (new seat) | |||||
Hengrove
| Party | Candidate | Votes | % | ±% | |
|---|---|---|---|---|---|
| Labour | W Graves | 1,950 | |||
| Labour | A Abrams | 1,774 | |||
| Labour | M Houlihan | 1,510 | |||
| Conservative | G Bridcut | 619 | |||
| Majority | |||||
| Labour win (new seat) | |||||
| Labour win (new seat) | |||||
| Labour win (new seat) | |||||
Hillfields
| Party | Candidate | Votes | % | ±% | |
|---|---|---|---|---|---|
| Labour | C Draper | 1,985 | |||
| Labour | F Vyvyan-Jones | 1,915 | |||
| Labour | R Thomas | 1,871 | |||
| Conservative | D Thompson | 1,032 | |||
| Conservative | C Baker | 996 | |||
| Conservative | P Haines | 983 | |||
| Majority | |||||
| Labour win (new seat) | |||||
| Labour win (new seat) | |||||
| Labour win (new seat) | |||||
Horfield
| Party | Candidate | Votes | % | ±% | |
|---|---|---|---|---|---|
| Labour | C Merrett | 2,467 | |||
| Labour | R Edwards | 2,400 | |||
| Labour | R Hewlett | 2,360 | |||
| Conservative | B Topham | 2,063 | |||
| Conservative | D Macduff | 1,893 | |||
| Conservative | R Wookey | 1,762 | |||
| Majority | |||||
| Labour win (new seat) | |||||
| Labour win (new seat) | |||||
| Labour win (new seat) | |||||
Knowle
| Party | Candidate | Votes | % | ±% | |
|---|---|---|---|---|---|
| Conservative | G Sprackling | 1,800 | |||
| Conservative | E Wright | 1,685 | |||
| Conservative | F Lawrence | 1,556 | |||
| Labour | G Sheppard | 973 | |||
| Labour | G England | 953 | |||
| Labour | G Cole | 912 | |||
| Liberal | D Beaven | 590 | |||
| Majority | |||||
| Conservative win (new seat) | |||||
| Conservative win (new seat) | |||||
| Conservative win (new seat) | |||||
Redland
| Party | Candidate | Votes | % | ±% | |
|---|---|---|---|---|---|
| Conservative | C Hebblethwaite | 1,528 | |||
| Conservative | G Keeley | 1,516 | |||
| Conservative | G Hebblethwaite | 1,506 | |||
| Liberal | J Ord | 849 | |||
| Liberal | C Sara | 840 | |||
| Liberal | C Ord | 816 | |||
| Labour | M Merrett | 450 | |||
| Labour | C Langham | 448 | |||
| Labour | R Langley | 421 | |||
| Majority | |||||
| Conservative win (new seat) | |||||
| Conservative win (new seat) | |||||
| Conservative win (new seat) | |||||
Somerset
| Party | Candidate | Votes | % | ±% | |
|---|---|---|---|---|---|
| Labour | H Willcox | 1,465 | |||
| Labour | D Jackson | 1,366 | |||
| Labour | J Comerford | 1,149 | |||
| Conservative | V Goodland | 722 | |||
| Conservative | J Finnimore | 562 | |||
| National Front | P Thomas | 424 | |||
| Majority | |||||
| Labour win (new seat) | |||||
| Labour win (new seat) | |||||
| Labour win (new seat) | |||||
Southmead
| Party | Candidate | Votes | % | ±% | |
|---|---|---|---|---|---|
| Labour | J Hole | 1,987 | |||
| Conservative | F McGough | 1,931 | |||
| Labour | S Grace | 1,848 | |||
| Labour | R Bridle | 1,801 | |||
| Conservative | T Wetherall | 1,779 | |||
| Conservative | I Hamilton | 1,779 | |||
| Ind. Conservative | G Chappell | 900 | |||
| Majority | |||||
| Labour win (new seat) | |||||
| Conservative win (new seat) | |||||
| Labour win (new seat) | |||||
Southville
| Party | Candidate | Votes | % | ±% | |
|---|---|---|---|---|---|
| Labour | F Smith | 1,336 | |||
| Labour | F Pidgeon | 1,260 | |||
| Labour | M Young | 1,202 | |||
| Conservative | W Blackmore | 1,061 | |||
| Conservative | L White | 907 | |||
| Conservative | P Barnwell | 876 | |||
| Majority | |||||
| Labour win (new seat) | |||||
| Labour win (new seat) | |||||
| Labour win (new seat) | |||||
St George East
| Party | Candidate | Votes | % | ±% | |
|---|---|---|---|---|---|
| Labour | H Bloom | 1,855 | |||
| Labour | L Rexworthy | 1,798 | |||
| Labour | D Beer | 1,779 | |||
| Conservative | K Mountstephen | 1,143 | |||
| Conservative | E Cockrell | 1,109 | |||
| Conservative | F Stockham | 1,027 | |||
| Majority | |||||
| Labour win (new seat) | |||||
| Labour win (new seat) | |||||
| Labour win (new seat) | |||||
St George West
| Party | Candidate | Votes | % | ±% | |
|---|---|---|---|---|---|
| Labour | I Rogers | 1,128 | |||
| Labour | J McLaren | 1,111 | |||
| Labour | M Rea | 1,088 | |||
| Liberal | V Hales | 591 | |||
| Liberal | A Chalmers | 515 | |||
| Conservative | I Beddoe | 475 | |||
| Liberal | D Seymour | 468 | |||
| National Front | A Nelmes | 238 | |||
| Majority | |||||
| Labour win (new seat) | |||||
| Labour win (new seat) | |||||
| Labour win (new seat) | |||||
St Paul
| Party | Candidate | Votes | % | ±% | |
|---|---|---|---|---|---|
| Labour | D McLaren | 1,045 | |||
| Labour | G Fowler | 995 | |||
| Labour | A Norton | 989 | |||
| Conservative | T Mort-Williams | 507 | |||
| Majority | |||||
| Labour win (new seat) | |||||
| Labour win (new seat) | |||||
| Labour win (new seat) | |||||
St Philip & Jacob
| Party | Candidate | Votes | % | ±% | |
|---|---|---|---|---|---|
| Labour | I Knight | 766 | |||
| Labour | L Lane | 759 | |||
| Labour | A Pegler | 754 | |||
| Conservative | J Douglas-Green | 292 | |||
| Majority | |||||
| Labour win (new seat) | |||||
| Labour win (new seat) | |||||
| Labour win (new seat) | |||||
Stapleton
| Party | Candidate | Votes | % | ±% | |
|---|---|---|---|---|---|
| Conservative | P Brook | 2,530 | |||
| Conservative | T Whiteley | 2,444 | |||
| Conservative | H Williams | 2,397 | |||
| Labour | G Bee | 2,080 | |||
| Labour | E Skuse | 2,015 | |||
| Labour | R Denyer | 1,980 | |||
| Majority | |||||
| Conservative win (new seat) | |||||
| Conservative win (new seat) | |||||
| Conservative win (new seat) | |||||
Stockwood
| Party | Candidate | Votes | % | ±% | |
|---|---|---|---|---|---|
| Labour | G Easton | 2,888 | |||
| Labour | V Bath | 2,796 | |||
| Labour | D Poole | 2,757 | |||
| Conservative | G Barrow | 2,558 | |||
| Conservative | J Howe | 2,525 | |||
| Conservative | R Huxham | 2,300 | |||
| Liberal | J Phillips | 778 | |||
| Majority | |||||
| Labour win (new seat) | |||||
| Labour win (new seat) | |||||
| Labour win (new seat) | |||||
Westbury-on-Trym
| Party | Candidate | Votes | % | ±% | |
|---|---|---|---|---|---|
| Conservative | R Wall | 3,995 | |||
| Conservative | D Poole | 3,950 | |||
| Conservative | C Alderson | 3,813 | |||
| Liberal | C Everett | 1,878 | |||
| Liberal | E David | 1,749 | |||
| Liberal | N Fern | 1,520 | |||
| Labour | M Waddington | 631 | |||
| Labour | G Waddington | 627 | |||
| Labour | R Willis | 614 | |||
| Majority | |||||
| Conservative win (new seat) | |||||
| Conservative win (new seat) | |||||
| Conservative win (new seat) | |||||
Windmill Hill
| Party | Candidate | Votes | % | ±% | |
|---|---|---|---|---|---|
| Labour | B Richards | 1,136 | |||
| Labour | C Roberston | 1,022 | |||
| Labour | R Wilmott | 1,009 | |||
| Conservative | D Watkins | 537 | |||
| Conservative | R Douglas-Green | 491 | |||
| National Front | R Bale | 326 | |||
| Majority | |||||
| Labour win (new seat) | |||||
| Labour win (new seat) | |||||
| Labour win (new seat) | |||||
References
- "Local Elections Handbook 1973". The Elections Centre. Retrieved 10 April 2016.
- Thomas, Colin (8 January 2020). "40 years ago, the far right in Bristol was faced down with music, pickets and ballots". The Bristol Cable. Retrieved 31 January 2020.
| County councils (England) |
|
|---|---|
| County councils (Wales) |
|
| County councils (Scotland) |
|
| Unicameral area | |
| Metropolitan boroughs |
|
| City corporations | |
| District councils (England) |
|
| District councils (Wales) |
|
| District councils (Northern Ireland) | |
| Town councils |
|
| Sui generis |
|
| Bristol City Council | |
|---|---|
| Mayor of Bristol | |
| West of England Mayor | |
| Avon County Council |
|
| |
This article is issued from Wikipedia. The text is licensed under Creative Commons - Attribution - Sharealike. Additional terms may apply for the media files.