1963 Swiss federal election

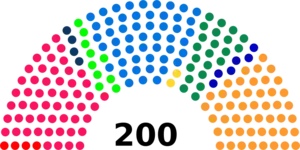
Federal elections were held in Switzerland on 27 October 1963.[1] The Social Democratic Party emerged as the largest party in the National Council, winning 53 of the 200 seats.[2]

Results

National Council

PartyVotes%Seats+/–
Social Democratic Party256,06326.6253+2
Free Democratic Party230,20023.94510
Conservative Christian Social Party225,16023.4148+1
Party of Farmers, Traders and Independents109,20211.3522–1
Alliance of Independents48,2245.01100
Liberal Democratic Union21,5012.246+1
Swiss Party of Labour21,0882.194+1
Social-Political Group16,9781.7740
Evangelical People's Party15,6901.6320
Other parties17,6431.830
Total961,749100.00200+4
Valid votes961,74997.44
Invalid/blank votes25,2482.56
Total votes986,997100.00
Registered voters/turnout1,493,02666.11
Source: Nohlen & Stöver

By constituency

Constituency Seats Electorate Turnout Party Votes Seats
won
Aargau 13 98,595 81,249 Social Democratic Party 312,603 4
Conservative People's Party 230,646 3
Free Democratic Party 196,631 3
Party of Farmers, Traders and Independents 144,763 2
Ring of Independents 55,165 1
Evangelical People's Party 28,002 0
Free Eligible Voters 26,879 0
Non-Partisan List of Evangelical Christian Citizens 11,089 0
Appenzell Ausserrhoden 2 Elected unopposed Free Democratic Party 1
Social Democratic Party 1
Appenzell Innerrhoden 1 3,705 1,203 Conservative Christian Social Party 897 1
Basel-Landschaft 5 42,790 25,426 Social Democratic Party 43,291 2
Free Democratic Party 29,718 1
Party of Farmers, Traders and Independents 19,239 1
Conservative Christian Social Party 18,323 1
Aktion Kanton Basel 14,814 0
Basel-Stadt 8 67,406 40,457 Social Democratic Party 102,355 3
Free Democratic Party 79,944 2
Conservative Christian Social Party 41,864 1
Liberal Party 37,572 1
Ring of Independents 35,872 1
Party of Labour 21,724 0
Bern 33 261,817 168,222 Social Democratic Party 1,954,709 12
Party of Farmers, Traders and Independents 1,746,618 11
Free Democratic Party 953,006 6
Conservative Christian Social Party 358,829 2
Ring of Independents 215,635 2
Evangelical People's Party 105,517 0
Non-Partisan List of Evangelical Christian Citizens 81,335 0
Fribourg 6 47,259 31,588 Conservative Christian Social Party 101,174 3
Free Democratic Party 42,696 2
Social Democratic Party 24,108 1
Party of Farmers, Traders and Independents 18,897 0
Geneva 10 71,064 31,340 Social Democratic Party 76,363 2
Free Democratic Party 61,622 2
Party of Labour 58,130 2
Liberal Party 51,990 2
Conservative Christian Social Party 48,249 2
Movement for Economic and Social Democracy 10,673 0
Glarus 2 Elected unopposed Social Democratic Party 1
Free Democratic Party 1
Grisons 5 38,865 27,605 Conservative Christian Social Party 55,869 2
Social-Political Group 39,508 2
Free Democratic Party 20,723 1
Social Democratic Party 18,219 0
Lucerne 9 72,436 60,804 Conservative Christian Social Party 269,439 5
Free Democratic Party 196,834 3
Social Democratic Party 49,397 1
Ring of Independents 27,511 0
Neuchâtel 5 41,830 18,992 Social Democratic Party 36,354 2
Free Democratic Party 24,256 2
Liberal Party 20,735 1
Party of Labour 11,752 0
Nidwalden 1 6,123 2,673 Conservative Christian Social Party 2,070 1
Obwalden 1 6,437 3,716 Conservative Christian Social Party 2,351 1
Liberal Party 1,256 0
Schaffhausen 2 18,034 15,727 Social Democratic Party 13,120 1
Free Democratic Party 12,488 1
Ring of Independents 3,398 0
Schwyz 3 22,023 16,214 Conservative Christian Social Party 23,482 2
Social Democratic Party 13,721 1
Free Democratic Party 10,286 0
Solothurn 7 56,117 47,859 Free Democratic Party 136,130 3
Social Democratic Party 109,551 2
Conservative Christian Social Party 80,155 2
St. Gallen 13 89,306 66,320 Conservative Christian Social Party 387,078 6
Free Democratic Party 223,957 4
Social Democratic Party 148,540 2
Ring of Independents 55,893 1
Ticino 7 53,710 36,719 Free Democratic Party 102,610 3
Conservative Christian Social Party 92,683 3
Social Democratic Party 47,837 1
Party of Farmers, Traders and Independents 8,483 0
Thurgau 6 43,802 32,047 Social Democratic Party 52,964 2
Conservative Christian Social Party 50,272 1
Party of Farmers, Traders and Independents 46,689 2
Free Democratic Party 37,409 1
Uri 1 8,894 5,662 Free Democratic Party 4,216 1
Vaud 16 121,832 52,307 Free Democratic Party 262,659 6
Social Democratic Party 230,205 4
Liberal Party 119,342 2
Party of Labour 101,271 2
Party of Farmers, Traders and Independents 66,096 1
Conservative Christian Social Party 44,872 1
Valais 7 51,557 36,878 Conservative Christian Social Party 163,699 5
Free Democratic Party 52,697 1
Social Democratic Party 38,745 1
Zug 2 Elected unopposed Conservative Christian Social Party 1
Free Democratic Party 1
Zürich 35 269,670 183,995 Social Democratic Party 1,731,988 10
Free Democratic Party 1,031,813 6
Party of Farmers, Traders and Independents 876,007 5
Ring of Independents 836,710 5
Conservative Christian Social Party 794,359 5
Evangelical People's Party 361,942 2
Social-Political Group 317,701 2
Party of Labour 135,780 0
Swiss Popular Movement Against Foreign Infiltration 111,629 0
Non-Partisan List of Evangelical Christian Citizens 76,452 0
List for Cleanliness in Politics 44,069 0
Non-Partisan Union 23,148 0
New Gotthard Ring 7,632 0
Swiss People's Party 4,536 0
Source: Bundesblatt, 28 November 1963

Council of the States

In several cantons the members of the Council of the States were chosen by the cantonal parliaments.[3]
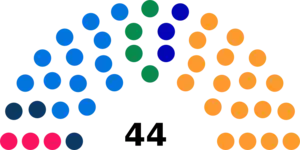
PartySeats+/–
Conservative Christian Social Party18+1
Free Democratic Party130
Party of Farmers, Traders and Independents4+1
Social Democratic Party3–1
Liberal Democratic Union30
Social-Political Group3+2
Alliance of Independents00
Total440
Source: Nohlen & Stöver

References

  1. Nohlen, D & Stöver, P (2010) Elections in Europe: A data handbook, p1895 ISBN 9783832956097
  2. Nohlen & Stöver, p1954
  3. Nohlen & Stöver, p1956
This article is issued from Wikipedia. The text is licensed under Creative Commons - Attribution - Sharealike. Additional terms may apply for the media files.