This page helps you to understand the various possibilities to display results on Wikidata Query. The query example page contains many good examples you can try!
After running a query, you can choose with the "Display" button which result view you want to display. Depending on your query and the data type, some of the views will be available.
#Countries in European Union with Flags and Population
# to be displayed as
# 1) Table
# 2) Image Grid
# 3) Map
# 4) Bar Chart
# 5) Bubble Chart
SELECT ?country ?countryLabel (MAX(?population) AS ?Population) (SAMPLE(?flag_image) AS ?Flag) (MAX(?coordinate) AS ?coor)
WHERE {
  wd:Q458 wdt:P150 ?country.   # European Union  contains administrative territorial entity
  OPTIONAL { ?country wdt:P41 ?flag_image. }
  OPTIONAL { ?country wdt:P36 ?capital. }
  OPTIONAL { ?country wdt:P1082 ?population. }
  OPTIONAL { ?capital wdt:P625  ?coordinate. }
  SERVICE wikibase:label { bd:serviceParam wikibase:language "en".
                           ?country rdfs:label ?countryLabel
                         }
}
GROUP BY ?country ?countryLabel
ORDER BY DESC(?Population)
|
 Display button. Try the query to the left as Table, Image Grid, Map, Bar Chart and Bubble Chart |
Default View
The default view can be changed for each SPARQL query by using a comment
#defaultView:[NAME]
For example:
#defaultView:ImageGrid
Table (default)
Shows the result data as table. It is the default view for results and can display every data type.
This will map every variable from the SPARQL select clause to a formatted table column.
 Table Result
 Table Result on small screens with flipped columns
Image Grid
The #defaultView:ImageGrid shows the result data as a grid with images.
Every grid item has a big picture and opens the gallery when clicking on it.
Contents an item is the formatted row data.
| Variable | Data Type | Mapping | Description |
|---|---|---|---|
| * | Commons Media | Grid Item | Image columns will create a grid item. |
Rows containing no image will be ignored.
Options:
| Option name | Type | Description |
|---|---|---|
hide | One or more variable names (strings, starting with ?), single value or array | Don’t show these variables in the result. |
#Even more cats, with pictures
#added before 2016-10
#defaultView:ImageGrid
SELECT ?itemDescription ?itemLabel ?item ?pic
WHERE
{
	?item wdt:P31 wd:Q146 .
	OPTIONAL {
		?item wdt:P18 ?pic
	}
	SERVICE wikibase:label { bd:serviceParam wikibase:language "en" }
}
|
 Image Grid
Try Out
|
Map
The #defaultView:Map shows the result data as map with Open Street Map data.
| Variable | Data Type | Mapping | Description |
|---|---|---|---|
| * | Coordinate | Map Marker | Columns will create a marker on the map. Content of that marker is the formatted row data. |
| ?layer | Map Marker Layer | Creates a colored map layer that allows filtering. |
Options:
| Option name | Type | Description |
|---|---|---|
hide | One or more variable names (strings, starting with ?), single value or array | Don’t show these variables in the result. Format of the array for multiple variables:#defaultView:Map{"hide":["?foo", "?bar"],"layer":"?bar"} |
layer | One or more variable names (strings, starting with ?), single value or array | Use these variables for the map layer, instead of the default ?layerLabel, ?layer. |
markercluster | boolean or object |
|
#Big cities, grouped into map layers by population
#defaultView:Map
SELECT DISTINCT ?city ?cityLabel (SAMPLE(?location) AS ?location) (MAX(?population) AS ?population) (SAMPLE(?layer) AS ?layer)
WHERE
{
  ?city wdt:P31/wdt:P279* wd:Q515;
        wdt:P625 ?location;
        wdt:P1082 ?population.
  FILTER(?population >= 500000).
  BIND(
    IF(?population < 1000000, "<1M",
    IF(?population < 2000000, "1M-2M",
    IF(?population < 5000000, "2M-5M",
    IF(?population < 10000000, "5M-10M",
    IF(?population < 20000000, "10M-20M",
    ">20M")))))
    AS ?layer).
  SERVICE wikibase:label { bd:serviceParam wikibase:language "en". }
}
GROUP BY ?city ?cityLabel
ORDER BY ?population
|
 Map with layers
Try Out
|
#Airports in Belgium
#added before 2016-10
#List of airports in Belgium
#defaultView:Map
SELECT DISTINCT ?airport ?airportLabel ?coor ?range
WHERE
{
  ?airport wdt:P31 wd:Q1248784 ;
          ?range wd:Q31;
          wdt:P625 ?coor.
  SERVICE wikibase:label { bd:serviceParam wikibase:language "en". }
}
|
 Map of airports in Belgium Try Out
|
Line, Area, Bar and Scatter Chart
#defaultView:LineChart, #defaultView:AreaChart, #defaultView:BarChart and #defaultView:ScatterChart shows one of these chart types.
| Variable | Data Type | Mapping | Description |
|---|---|---|---|
| * | Number Label DateTime | X-Axis Y-Axis | First will be X-axis, second Y-axis |
| * | Label | Category / Legend Item (optional) | Will only be used after the above are mapped |
| * | Label | Storyboard / Animation (optional) | Will only be used after the above are mapped |
LineChart
#Number of paintings per decade
#defaultView:LineChart
SELECT ?decade (COUNT(?decade) AS ?Paintings)
WHERE {
  ?item wdt:P31 wd:Q3305213 . # instance of painting
  ?item wdt:P571 ?inception .
  BIND( year(?inception) as ?year ).
  BIND( ROUND(?year/10)*10 as ?decade ) .
  FILTER( ?year > 1400)
} GROUP BY ?decade
ORDER BY ?decade
|
#Population of countries sharing a border with Germany
#defaultView:LineChart
SELECT ?country  ?year ?population ?countryLabel WHERE {
  {
    SELECT ?country ?year (AVG(?population) AS ?population) WHERE {
      {
        SELECT ?country (str(YEAR(?date)) AS ?year) ?population WHERE {
          ?country wdt:P47 wd:Q183.
          ?country p:P1082 ?populationStatement.
          ?populationStatement ps:P1082 ?population.
          ?populationStatement pq:P585 ?date.
        }
      }
    }
    GROUP BY ?country ?year
  }
  SERVICE wikibase:label { bd:serviceParam wikibase:language "en". }
}
|
 Line Chart Try Out
|
AreaChart
#Cancer deaths per year and cancer type
#defaultView:AreaChart
SELECT ?cid (str(SAMPLE(?year)) AS ?year )  (COUNT(*) AS ?count)  ?cause WHERE {
  ?pid wdt:P31 wd:Q5.
  ?pid wdt:P509 ?cid.
  ?cid wdt:P279* wd:Q12078.
  OPTIONAL {
    ?cid rdfs:label ?cause.
    FILTER((LANG(?cause)) = "en")
  }
  ?pid wdt:P570 ?_date_of_death.
  BIND ( YEAR(?_date_of_death) AS ?year )
  FILTER( BOUND(?cause)  )
  FILTER( BOUND(?year)  )
  FILTER( ?year > 1960 )
}
GROUP BY ?cid ?cause ?year
|
 Area Chart Try Out
|
BarChart
#Battles per year per continent and country last 80 years (animated)
#defaultView:BarChart
SELECT (SAMPLE(?_continentLabel) AS ?contient) (COUNT(?_country) AS ?battles) (SAMPLE(?_countryLabel) AS ?_countryLabel) (SAMPLE(?year) AS ?year)  WHERE {
  ?subj wdt:P31 wd:Q178561.
  OPTIONAL { ?subj wdt:P580 ?d1. }
  OPTIONAL { ?subj wdt:P585 ?d2. }
  OPTIONAL { ?subj wdt:P582 ?d3. }
  BIND(IF(!BOUND(?d1), IF(!BOUND(?d2), ?d3, ?d2), ?d1) AS ?date)
  BIND(str(YEAR(?date)) AS ?year)
  ?subj wdt:P276 ?_loc.
  ?_loc wdt:P17 ?_country.
  ?_country wdt:P30 ?_continent.
  ?_country rdfs:label ?_countryLabel.
  ?_continent rdfs:label ?_continentLabel.
  BIND((NOW()) - ?date AS ?distance)
  FILTER(BOUND(?year))
  FILTER((LANG(?_countryLabel)) = "en")
  FILTER((LANG(?_continentLabel)) = "en")
  FILTER((0 <= ?distance) && (?distance < 31 * 12 * 80))
}
GROUP BY ?year ?_country
ORDER BY ?_countryLabel
|
ScatterChart
# Scatter Chart river watershed area in km² plotted over length in km
PREFIX wikibaseβ: <http://wikiba.se/ontology-beta#>
#defaultView:ScatterChart
# river watershed area in km² plotted over length in km, using new normalized units support
# (rivers shorter than 500 km excluded to avoid crashing the browser when trying to render too many results)
SELECT ?river (SAMPLE(?length) AS ?length) (SAMPLE(?area) AS ?area) ?riverLabel WHERE {
  ?river wdt:P31/wdt:P279* wd:Q355304;
         p:P2043/psn:P2043/(wikibase:quantityAmount|wikibaseβ:quantityAmount) ?lengthInMetres;
         p:P2053/psn:P2053/(wikibase:quantityAmount|wikibaseβ:quantityAmount) ?areaInSquareMetres.
  BIND(?lengthInMetres / 1000 AS ?length).
  BIND(?areaInSquareMetres / 1000000 AS ?area).
  FILTER(?length > 500).
  SERVICE wikibase:label { bd:serviceParam wikibase:language "en". }
}
GROUP BY ?river ?riverLabel
|
#Number of films by year and genre
#defaultView:ScatterChart
SELECT   ?year  (COUNT(?_genre) AS ?count ) (SAMPLE(?_genreLabel) AS ?label )  (?year as ?year_shown) WHERE {
  ?item wdt:P31 wd:Q11424.
  ?item wdt:P577 ?_publication_date.
  ?item wdt:P136 ?_genre.
  ?_genre rdfs:label ?_genreLabel.
  BIND(str(YEAR(?_publication_date)) AS ?year)
  FILTER((LANG(?_genreLabel)) = "en")
  FILTER (?_publication_date >= "2000-00-00T00:00:00Z"^^xsd:dateTime)
}
GROUP BY ?_genreLabel ?year
HAVING (?count > 30)
|
 Scatter Chart (animated) Try Out |
Bubble Chart
The #defaultView:BubbleChart shows a bubble chart where the size and the color of the bubble can configured.
When an item is provided a bubble is linked to Wikidata.org.
| Variable | Data Type | Mapping |
|---|---|---|
| * | Label | Bubble Label |
| * | Number | Bubble Size |
| * | Item | Bubble Link (optional) |
| ?rgb | Color | Bubble Color (optional) |
#Overall causes of death ranking
#added before 2016-10
#defaultView:BubbleChart
SELECT ?cid ?cause (count(*) as ?count)
WHERE
{
	?pid wdt:P31 wd:Q5 .
	?pid wdt:P509 ?cid .
	OPTIONAL {
		?cid rdfs:label ?cause
		filter (lang(?cause) = "en")
	}
}
GROUP BY ?cid ?cause
ORDER BY DESC(?count) ASC(?cause)
|
 Bubble Chart Try Out
|
Tree Map
#defaultView:TreeMap shows a zoomable tree map.
| Variable | Data Type | Mapping | Description |
|---|---|---|---|
| * | Label | Label | 1st label in a row will be 1st level in tree map. 2nd label will be 2nd level. 3rd label will be 3rd level etc.. |
| * | Item | Link (optional) |
#Popular television series (in treeview)
#added before 2016-10
#defaultView:TreeMap
SELECT ?show ?showLabel  ?season ?seasonLabel ?episode ?episodeLabel
WHERE
{
	{	BIND(wd:Q886 as ?show) .      # The Simpsons
		?season wdt:P361 ?show .
		?episode wdt:P361 ?season .
	} UNION
	{	BIND(wd:Q16538 as ?show) .    # South Park
		?season wdt:P361 ?show .
  		?episode wdt:P361 ?season .
	} UNION
	{	BIND(wd:Q147235 as ?show) .   # How I Met Your Mother
		?season wdt:P361 ?show .
  		?episode wdt:P361 ?season .
	}
	SERVICE wikibase:label {  bd:serviceParam wikibase:language "en" }
}
|
 Tree Map Try Out
|
Tree
#defaultView:Tree shows an expandable tree.
| Variable | Data Type | Mapping | Description |
|---|---|---|---|
| * | Item | Node ID | First item will be a root node The following items in the same row will be nested. |
| * | Label | Node Label (optional) | Labels will be appended to current node. |
| * | Number | Node Label (optional) | |
| * | Commons Media | Item image |
#defaultView:Tree
SELECT ?continent ?continentFlag ?continentLabel ?country ?countryLabel ?countryFlag ?region ?regionLabel ?regionFlag ?city ?cityLabel ( 'Population:' as ?popLabel )  ?pop  ?cityImage
WHERE
{
  {
    SELECT * WHERE {
      ?continent wdt:P31 wd:Q5107.
      ?country wdt:P30 ?continent.
      ?country wdt:P31 wd:Q6256.
      ?country wdt:P150 ?region.
      OPTIONAL {
        ?continent wdt:P242 ?continentFlag.
        ?country wdt:P41 ?countryFlag.
        ?region wdt:P41 ?regionFlag.
      }
      OPTIONAL {
        ?region wdt:P36 ?city.
        ?city wdt:P31 wd:Q515.
        ?city wdt:P1082 ?pop.
        ?city wdt:P18 ?cityImage.
      }
    }
  }
  SERVICE wikibase:label { bd:serviceParam wikibase:language "en". }
}
|
 Tree Try Out
|
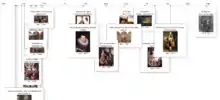
Timeline
#defaultView:Timeline shows an explorable timeline.
| Variable | Data Type | Mapping | Description |
|---|---|---|---|
| * | DateTime | Item Point in Time Item End Point in Time | First date in a row sets the item position in the timeline. If a second date is present a start and end date will be set. |
| * | Commons Media | Item image |
Options:
| Option name | Type | Description |
|---|---|---|
hide | One or more variable names (strings, starting with ?), single value or array | Don’t show these variables in the result. |
#defaultView:Timeline
SELECT ?item ?itemLabel ?launchdate (SAMPLE(?image) AS ?image)
WHERE
{
    ?item wdt:P31 wd:Q26529 .      # Space probe
    ?item wdt:P619 ?launchdate .
    OPTIONAL { ?item wdt:P18 ?image }
    SERVICE wikibase:label { bd:serviceParam wikibase:language "en" }
}
GROUP BY ?item ?itemLabel ?launchdate
|
 Timeline (of an other query) Try Out
|
Dimensions
#defaultView:Dimensions shows dimension and their links.
It also allows filtering them by selecting an axis fraction.
| Variable | Data Type | Mapping | Description |
|---|---|---|---|
| * | Label | Dimension | Every column in the result row is mapped to a dimension |
| * | Number | ||
| * | DateTime |
#defaultView:Dimensions
SELECT ?elementLabel ?_boiling_point ?_melting_point ?_electronegativity ?_density ?_mass WHERE {
  ?element wdt:P31 wd:Q11344.
  ?element wdt:P2102 ?_boiling_point.
  ?element wdt:P2101 ?_melting_point.
  ?element wdt:P1108 ?_electronegativity.
  ?element wdt:P2054 ?_density.
  ?element wdt:P2067 ?_mass.
  SERVICE wikibase:label { bd:serviceParam wikibase:language "en". }
}
LIMIT 100
|
 Dimensions Try Out
|
Graph
Shows an interactive graph that allow hierarchically ordering and exploring items.
| Variable | Data Type | Mapping | Description |
|---|---|---|---|
| * | Item | Node ID | First item in a row will have an arrow pointing to the items in the same row |
| * | Label | Node Label (optional) | |
| * | Commons Media | Node Image (optional) | |
| ?rgb | Color | Node Color (optional) | |
| * | Number | Node Size (optional) |
#US presidents and spouses
#defaultView:Graph
SELECT ?p ?pLabel ?ppicture ?w ?wLabel ?wpicture
WHERE
{
   wd:Q30 p:P6/ps:P6 ?p .
   ?p wdt:P26 ?w .
   OPTIONAL{
    ?p wdt:P18 ?ppicture .
    ?w wdt:P18 ?wpicture .
   }
   SERVICE wikibase:label { bd:serviceParam wikibase:language "en". }
}
|
#Children of Genghis Khan
#added before 2016-10
#defaultView:Graph
PREFIX gas: <http://www.bigdata.com/rdf/gas#>
SELECT ?item ?itemLabel ?pic ?linkTo ?linkToLabel
WHERE
{
  SERVICE gas:service {
    gas:program gas:gasClass "com.bigdata.rdf.graph.analytics.SSSP" ;
                gas:in wd:Q720 ;
                gas:traversalDirection "Forward" ;
                gas:out ?item ;
                gas:out1 ?depth ;
                gas:maxIterations 4 ;
                gas:linkType wdt:P40 .
  }
  OPTIONAL { ?item wdt:P40 ?linkTo }
  OPTIONAL { ?item wdt:P18 ?pic }
  SERVICE wikibase:label {bd:serviceParam wikibase:language "en,ru,ja,zh,az,ca" }
}
|
 Graph of children of Genghis Khan
Try Out
|
Additional Information
RDF Data Type Mapping
| RDF Type | RDF Data Type | Constraint | Data Type |
|---|---|---|---|
| URI | String starts with http://www.wikidata.org/entity/Q | Entity | |
| URI | String starts with http://commons.wikimedia.org/wiki/Special:FilePath | Commons Media | |
| Literal | http://www.w3.org/2001/XMLSchema#dateTime | DateTime | |
| Literal | http://www.opengis.net/ont/geosparql#wktLiteral | Coordinate | |
| Literal |
http://www.w3.org/2001/XMLSchema#double |
Number | |
| Literal | Has no RDF Data Type | Label | |
| Literal | Has property xml:lang | Label | |
| Literal | String matches /^[0-9A-F]{6}$/ | Color |
Formatting
There is special formatting for the following data types:
| Data Type | Format |
|---|---|
| Entity | Link to Wikidata.org Label is shortened to wd:Qxx Explore an item (magnify icon) |
| DateTime | MM DD, YYYY Tooltip shows raw ISO timestamp |
| Commons Media | Link to Commons.Wikimedia.org Displaying Gallery ( image icon ) |
Mobile / Responsive
Result views are made to work on different devices and resolutions. Their appearance may change depending on the space they can use.
Embed Mode
Result views can be linked or embedded via iframes. You can get the regarding link or code by clicking Link in the above menu. See the difference: link to a query and link to a result
or the embed code:
<iframe style="width:80vw; height:50vh;" scrolling="yes" frameborder="0" src="http://tinyurl.com/zwf4k2w">
Download results
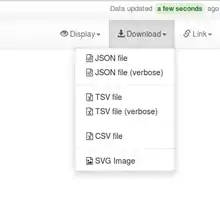
There are several ways to export the results of a query.
JSON, TSV and CSV are three different open-standard formats to download the data.
You can also download some of the graphic views as a SVG file: this feature works with all the views except table, image grid, timeline, graph builder, map, and graph.
Default View
The default view can be change for each SPARQL query by using a comment:
#defaultView:[NAME]
For example:
#defaultView:ImageGrid
Result view options
Result views can be configured with various options, which are specified in JSON (Q2063) format, either following the defaultView comment or following a separate view comment.
#defaultView:Map{"layer": "?typeLabel"}
#view:ImageGrid{"hide": "?coords"}
External tools
See Wikidata:Tools/Visualize data for a list of external tools to visualize data.