One Component Systems
All materials can exist in three phases: solid, liquid, and gas. All one component systems share certain characteristics, so that a study of a typical one component system will be quite useful.
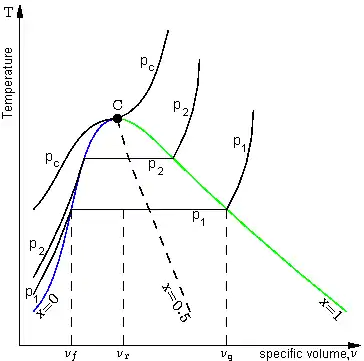
For this analysis, we consider heat transferred to the substance at constant pressure. The above chart shows temperature vs. specific volume (1/density) curves for at three different constant pressures. The three line-curves labeled p1, p2, and pc above are isobars, showing conditions at constant pressure. When the liquid and vapor coexist, it is called a saturated state. There is no change in temperature or pressure when liquid and vapor are in equilibrium, so that the temperature is called saturation temperature and the pressure is called saturation pressure. Saturated states are represented by the horizontal lines in the chart. In the temperature range where both liquid and vapor of a pure substance can coexist in equilibrium, for every value of saturated temperature, there is only one corresponding value of saturation pressure. If the temperature of the liquid is lower than the saturation temperature, it is called subcooled liquid. If the temperature of the vapor or gas is greater than the saturation temperature it is called superheated vapor.
The amount of liquid and vapor in a saturated mixture is specified by its quality x, which is the fraction of vapor in the mixture. Thus, the horizontal line representing the vaporization of the fluid has a quality of x=0 at the left endpoint where it is 100% liquid and a quality of x=1 at the right endpoint where it is 100% vapor. The blue curve in the preceding diagram shows saturation temperatures for saturated liquid i. e. where x=0. The green curve in the diagram shows saturation temperatures for saturated vapor i. e. where x=1. These curves are not isobars.
If you also consider the solid state, then we get the phase diagram for the material. The point where the solid, liquid, and the vapor state exist in equilibrium is called the
triple point. Note that as the saturation temperatures increase, the liquid and vapor specific volumes approach each other until the blue and green curves come together and meet at point C on the pc isobar. At that point C, called the critical point, the liquid and vapor states merge together and all their thermodynamic properties become the same. The critical point has a certain temperature Tc, and pressure pc, which depend on the substance in question. At temperatures above the critical point, the substance is considered a super-heated gas.
This diagram is based on the diagram for water. Other pure (one-component) substances have corresponding temperature vs. specific volume diagrams which are fairly similarly shaped, but the temperatures, pressures, and specific volumes will vary.
The thermodynamic properties of materials are given in charts. One commonly used chart is the Mollier Chart, which is the plot of enthalpy versus entropy. The pressure enthalpy chart is frequently used in refrigeration applications. Charts such as these are useful because many processes are isenthalpic, so obtaining values would be as simple as drawing a straight line on the chart and reading off the data.
Steam tables give the values of specific volume, enthalpy, entropy, and internal energy for different temperatures for water. They are of great use to an engineer, with applications in steam turbines, steam engines, and air conditioning, among others.
Gas tables give the same equations for common gases like air. Although most gases roughly obey the ideal gas equation, gas tables note the actual values which are more accurate in many cases. They are not as important as steam tables, but in many cases it is much easier to lookup from a table rather than compute answers.
Gibbs Phase Rule
Gibbs phase rule states that for a heterogeneous system in equilibrium with C components in P phases, the degree of freedom F = C - P + 2. Thus, for a one component system with two phases, there is only one degree of freedom. F=1-2+2 F =1 That is, if you are given either the pressure or temperature of wet steam, you can obtain all the properties, while for superheated steam, which has just one phase, you will need both the pressure and the temperature.
Psychrometry
Psychrometry is the study of air and water vapor mixtures for air conditioning. For this application, air is taken to be a mixture of nitrogen and oxygen with the other gases being small enough so that they can be approximated by more of nitrogen and oxygen without much error. In this psychrometry section, vapor refers to water vapor. For air at normal (atmospheric) pressure, the saturation pressure of vapor is very low. Also, air is far away from its critical point in those conditions. Thus, the air vapor mixture behaves as an ideal gas mixture. If the partial pressure of the vapor is smaller than the saturation pressure for water for that temperature, the mixture is called unsaturated. The amount of moisture in the air vapor mixture is quantified by its humidity.
The absolute humidity ω is the ratio of masses of the vapor and air, i.e., ω = mv/ma. Now, applying ideal gas equation, pV = mRT for water vapor and for air, we have, since the volume and temperature are the same, ω = 0.622 pv/pa. The ratio of specific gas constants (R in preceding equation) of water vapor to air equals 0.622 .
The relative humidity φ is the ratio of the vapor pressure to the saturation vapor pressure at that temperature, i.e., φ = pv/pv,sat.
The saturation ratio is the ratio of the absolute humidity to the absolute humidity at saturation, or, ψ = ω/ωsat. It is easy to see that the saturation ratio is very close to the value of relative humidity.
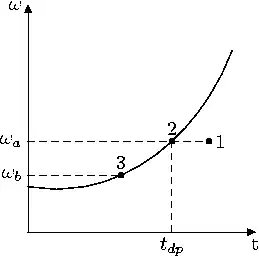
The above plot shows the value of absolute humidity versus the temperature. The initial state of the mixture is 1, and it is cooled isobarically, and at constant absolute humidity. When it reaches 2, it is saturated, and its absolute humidity is ωa. Further cooling causes condensation and the system moves to point 3, where its absolute humidity is ωb. The temperature at 2 is called the dew point.
It is customary to state all quantities in psychrometry per unit mass of dry air. Thus, the amount of air condensed in the above chart when moving from 2 to 3 is ωb − ωa.
Adiabatic Saturation

Consider an unsaturated mixture entering a chamber. Suppose water was sprayed into the stream, so that the humidity increases and it leaves as a saturated mixture. This is accompanied by a loss of temperature due to heat being removed from the air which is used for vaporization. If the water supplied is at the temperature of exit of the stream, then there is no heat transfer from the water to the mixture. The final temperature of the mixture is called adiabatic saturation temperature.
Wet Bulb Temperature
The relative humidity of air vapor mixtures is measured by using dry and wet bulb thermometers. The dry bulb thermometer is an ordinary thermometer, while the wet bulb thermometer has its bulb covered by a moist wick. When the mixture flows past the two thermometers, the dry bulb thermometer shows the temperature of the stream, while water evaporates from the wick and its temperature falls. This temperature is very close to the adiabatic saturation temperature if we neglect the heat transfer due to convection.
Psychrometric Chart
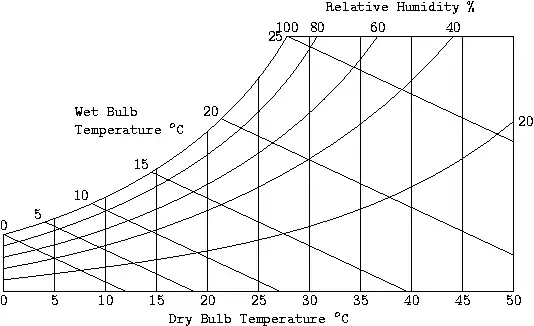
This chart gives the value of absolute humidity versus temperature, along with the enthalpy. From this chart you can determine the relative humidity given the dry and wet bulb temperatures. We have, from the first law, that for a flow system with no heat transfer, the enthalpy is a constant. Now, for the adiabatic saturation process, there is no heat transfer taking place, so that the adiabatic saturation lines are the same as the wet bulb temperature and the constant enthalpy lines.
Questions
1. The temperature at Phoenix is 35 °C with a relative humidity of 40%. Can a room be cooled using a conventional air cooler?
- We need to find the wet bulb temperature for the point T = 35°C and φ = 40%. We have, from the psychrometric chart, the wet bulb temperature is between 20 and 25°C. Thus, you can cool the room down to a comfortable temperature using an evaporative cooler.
2. The temperature of Los Angeles is 37 °C with relative humidity of 83%. To what temperature can a room be cooled using a conventional air cooler?
- The wet bulb temperature is about 34.2°C for this situation. Thus, you cannot use an ordinary cooler to reduce room temperature in this situation. You will need to use an air conditioner.
Air Conditioning
The human body can work efficiently only in a narrow range of conditions. Further, it rejects about 60 W of heat continuously into the surroundings, and more during heavy exercise. The temperature of the body is maintained by the evaporation of sweat from the body. Thus, for comfort, both the temperature and the relative humidity should be low.
Conventional air conditioning consists of setting the humidity at an acceptable level, while reducing the temperature. Reducing the humidity to zero is not the ideal objective. For instance, low humidity leads to issues like high chances of static electricity building up, leading to damage of sensitive electronic equipment. A humidity level of 50% is more acceptable in this case.
The most common method of reducing humidity is to cool the air using a conventional air conditioner working on a reversed Carnot cycle. The vapor that condenses is removed. Now, the air that is produced is very cold, and needs to be heated back up to room temperature before it is released back to the air conditioned area.
Common Thermodynamic Cycles
Several thermodynamic cycles used in machines can be approximated with idealized cycles. It was shown previously that a Carnot engine was the most efficient engine operating between two thermal reservoirs. However, due to practical difficulties, Carnot cycle cannot be implemented in all situations. The following sections deal with idealized (non Carnot) systems found in practice.
Rankine Cycle
In the Rankine cycle, also called the standard vapor power cycle, the working fluid follows a closed cycle. We will consider water as a working substance. Other materials can be also used, for example organic one (see Organic Rankine Cycle); properties of the working fluids in use has great influence on the actual process. In the Rankine cycle, water is pumped from a low pressure to a high pressure using a liquid pump. This water is then heated in the boiler at constant pressure where its temperature increases and it is converted to superheated vapor. This vapor is then expanded in an expander to generate work. This expander can be a turbine or a reciprocating (i.e. piston) machine such as those used in older steam locomotive or ship. The output of the expander is then cooled in a condenser to the liquid state and fed to the pump. The Rankine cycle differs from the Carnot cycle in that the input to the pump is a liquid (it is cooled more in the condenser). This allows the use of a small, low power pump due to the lower specific volume of liquid compared to steam. Also, the heat transfer in the boiler takes place mainly as a result of a phase change, compared to the isothermal heating of the ideal gas in the Carnot cycle, so that the efficiency is quite good (even though it is still lower than the Carnot efficiency). The amount of heat transferred as the liquid is heated to its boiling point is very small compared to the heat transfer during phase change. The steam is superheated so that no liquid state exists inside the turbine. Condensation in the turbine can be devastating as it can cause corrosion and erosion of the blades.
There are several modifications to the Rankine cycle leading to even better practical designs. In the reheat cycle there are two expanders working in series, and the steam from the high pressure stage is heated again in the boiler before it enters the low pressure expander. This avoids the problem of moisture in the turbine and also increases the efficiency. The regenerative cycle is another modification to increase the efficiency of the Rankine cycle. In many Rankine cycle implementations, the water enters the boiler in the subcooled state, and also, the large difference in temperature between the one at which heat is supplied to the boiler and the fluid temperature will give rise to irreversibilities which will cause the efficiency to drop. In the regenerative cycle, the output of the condenser is heated by some steam tapped from the expander. This causes the overall efficiency to increase, due to the reasons noted above.
Otto Cycle
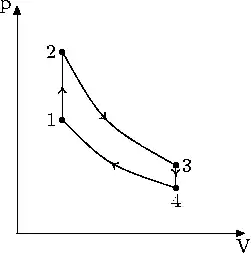
The Otto Cycle is the idealization for the process found in the reciprocating internal combustion engines which are used by most automobiles. While in an actual engine the gas is released as exhaust, this is found to be a good way to analyze the process. There are, of course, other losses too in the actual engine. For instance, partial combustion and aspiration problems for a high speed engine. The working material in the idealized cycle is an ideal gas, as opposed to the air fuel mixture in an engine.
- Heat is transferred at constant volume during 1-2.
- The gas expands reversibly and adiabatically during 2-3, where work is done.
- Heat is rejected at constant volume at low temperature during 3-4.
- The gas is compressed reversibly and adiabatically in 4-1.
Analysis
Heat is transferred at constant volume in 1-2, so that Q1-2 = m cv(T2 − T1). Similarly, the heat rejected in 3-4 is Q3-4 = m cv (T3 − T4). The thermal efficiency of the Otto cycle is thus
ηth = (Q1-2 − Q3-4)/Q1-2
ηth = 1 − Q3-4/Q1-2
ηth = 1 − (T3 − T4)/(T2 − T1)
Since 2-3 and 4-1 are reversible adiabatic processes involving an ideal gas, we have,
T2/T3 = (V3/V2)γ − 1
and
T4/T1 = (V1/V4)γ − 1
But,
V1 = V2
and
V3 = V4
So, we have
T2/T3 = T1/T4
Thus,
ηth = 1 − (T3/T2)(1 − T4/T3)/(1 − T1/T2)
Or
ηth = 1 − T3/T2
If we introduce the term rc = V3/V2 for the compression ratio, then we have,
ηth = 1 − rc1 − γ
As can be seen, increasing the compression ratio will improve thermal efficiency. However, increasing the compression ratio causes the peak temperature to go up, which may cause spontaneous, uncontrolled ignition of the fuel, which leads to a shock wave traveling through the cylinder, and is called knocking.
Diesel Cycle
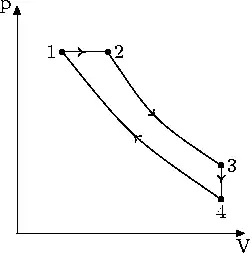
The Diesel cycle is the idealized cycle for compression ignition engines (ones that don't use a spark plug). The difference between the Diesel cycle and the Otto cycle is that heat is supplied at constant pressure.
- Heat is supplied reversibly at constant pressure in 1-2.
- Reversible adiabatic expansion during which work is done in 2-3.
- Heat is rejected reversibly at constant volume in 3-4.
- Gas is compressed reversibly and adiabatically in 4-1.
Analysis
Heat is transferred to the system at constant pressure during 1-2 so that
Qin = m cp (T2 − T1)
Heat is rejected by the system at constant volume during 3-4:
Qout = m cv (T3 − T4)
Thus, the efficiency of the Diesel cycle is
ηth = (Qin − Qout)/Qin
ηth = 1 − Qout/Qin
ηth = 1 − (cv (T3 − T4))/(cp (T2 − T1))
ηth = 1 − (1/γ) (T3 − T4)/(T2 − T1)
We define the cutoff ratio as rt = V2/V1, and since the pressures at 1 and 2 are equal, we have, applying the ideal gas equation, T2/T1 = rt. Now, for the adiabatic processes 2-3 and 4-1 we have,
Since V3 = V4, we have
Dual Cycle
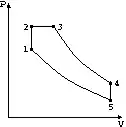
The dual cycle is sometimes used to approximate actual cycles as the time taken for heat transfer in the engine is not zero for the Otto cycle (so not constant volume). In the Diesel cycle, due to the nature of the combustion process, the heat input does not occur at constant pressure.
Gas Turbine Cycle (or Joule-Brayton Cycle)
Gas turbines are rotary internal combustion engines. As the first stage air is drawn in from outside and compressed using a compressor. Then the fuel is introduced and the mixture is ignited in the combustion chamber. The hot gases are expanded using a turbine which produces work. The output of the turbine is vented outside as exhaust.
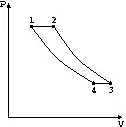
The ideal gas turbine cycle is shown above. The four stages are
- Heat input at constant pressure during 1-2.
- Reversible adiabatic expansion during 2-3, where work is done.
- Heat rejection at constant pressure during 3-4.
- Reversible adiabatic compression during 4-1 where work is consumed.
Large amount of work is consumed in process 4-1 for a gas turbine cycle as the working material (gas) is very compressible. The compressor needs to handle a large volume and achieve large compression ratios.
Analysis
The heat input in a gas turbine cycle is given by Qin = m cp (T2 - T1) and the heat rejected Qout = m cp (T3 - T4). Thus the thermal efficiency is given by
Since the adiabatic processes take place between the same pressures, the temperature ratios are the same
Or
Where rp is the pressure ratio and is a fundamental quantity for the gas turbine cycle.
Refrigeration Cycles
The ideal refrigeration cycle is reverse of Carnot cycle, working as a heat pump instead of as a heat engine. However, there are practical difficulties in making such a system work.
The gas refrigeration cycle is used in aircraft to cool cabin air. The ambient air is compressed and then cooled using work from a turbine. The turbine itself uses work from the compressed air, further cooling it. The output of the turbine as well as the air which is used to cool the output of the compressor is mixed and sent to the cabin.
The Rankine vapor-compression cycle is a common alternative to the ideal Carnot cycle. A working material such as Freon or R-134a, called the refrigerant, is chosen based on its boiling point and heat of vaporization. The components of a vapor-compression refrigeration system are the compressor, condenser, the expansion (or throttling) valve, and the evaporator. The working material (in gaseous form) is compressed by the compressor, and its output is cooled to a liquid in the condenser. The output of the condenser is throttled to a lower pressure in the throttling valve, and sent to the evaporator which absorbs heat. The gas from the evaporator is sent to the compressor, completing the cycle.
Standard refrigeration units use the throttling valve instead of a turbine to expand the gas as the work output that would be produced is not significant to justify the cost of a turbine. There are irreversibilities associated with such an expansion, but it is cost effective when construction costs are considered.