2016 United States presidential election in Wyoming
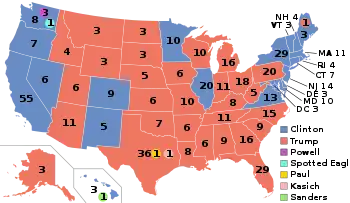
The 2016 United States presidential election in Wyoming was held on November 8, 2016, as part of the 2016 United States presidential election in which all 50 states plus the District of Columbia participated. Wyoming voters chose electors to represent them in the Electoral College via a popular vote pitting the Republican Party's nominee, businessman Donald Trump, and running mate Indiana Governor Mike Pence against Democratic Party nominee, former Secretary of State Hillary Clinton and her running mate, Virginia Senator Tim Kaine.
| |||||||||||||||||||||||||||||||||
| Turnout | 57.9% | ||||||||||||||||||||||||||||||||
|---|---|---|---|---|---|---|---|---|---|---|---|---|---|---|---|---|---|---|---|---|---|---|---|---|---|---|---|---|---|---|---|---|---|
| |||||||||||||||||||||||||||||||||
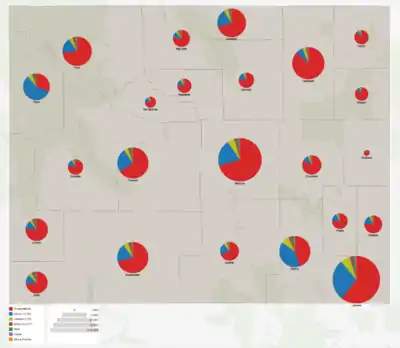
 County Results
| |||||||||||||||||||||||||||||||||
| |||||||||||||||||||||||||||||||||
.jpg.webp)

| Elections in Wyoming |
|---|
 |
On March 1 and April 9, 2016, in the presidential primaries, Wyoming voters expressed their preferences for the Democratic, Republican, Libertarian, and Constitution parties' respective nominees for president. Registered members of each party only voted in their party's primary, while voters who were unaffiliated chose any one primary in which to vote. Prior to the election, Wyoming was considered to be a state Trump would win or a safe red state.
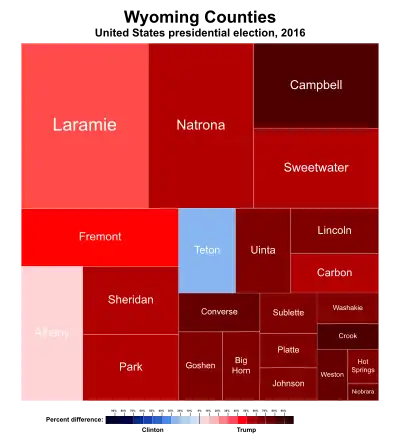
Donald Trump won the election in Wyoming with 67.4% of the vote. Hillary Clinton received 21.6% of the vote. Gary Johnson of the Libertarian Party received 5.1%.[2] Wyoming, a solidly Republican state, has not voted for a Democrat in a presidential election since it went for Lyndon B. Johnson in 1964. Trump carried every county with the exception of Teton County. His 46.3-point margin over Clinton not only made Wyoming the most Republican state in the 2016 election,[3] but also the largest margin of victory by any presidential candidate in the state's history, besting Ronald Reagan's 42.3-point margin in 1984, though Ronald Regan won the highest percentage in the state in 1984, winning an astonishing 70.5% of the vote. Clinton's 21.88% vote share was the lowest of any major party presidential nominee in Wyoming history.
Primary elections
The incumbent President of the United States, Barack Obama, a Democrat and former U.S. Senator of Illinois, was first elected president in the 2008 election, running with former Senator Joe Biden of Delaware. Defeating the Republican nominee, Senator John McCain of Arizona, with 52.9% of the popular vote and 68% of the electoral vote,[4][5] Obama succeeded two-term Republican President George W. Bush, the former Governor of Texas. Obama and Biden were reelected in the 2012 presidential election, defeating former Massachusetts Governor Mitt Romney with 51.1% of the popular vote and 61.7% of electoral votes.[6] Since the end of 2009, polling companies such as Gallup have found Obama's approval ratings to be between 40 and 50 percent.[7][8]
Following his second term, Barack Obama was not eligible for another reelection. In October 2015, Obama's running-mate and two-term Vice President Joe Biden decided not to enter the race for the Democratic presidential nomination either.[9] With their term expiring on January 20, 2017, the electorate was asked to elect a new president, the 45th president and 48th vice president of the United States, respectively.
Republican caucuses

| Candidate | Votes | Percentage | Actual delegate count | ||
|---|---|---|---|---|---|
| Bound | Unbound | Total | |||
| Ted Cruz | 1,128 | 70.94% | 9 | 0 | 9 |
| Marco Rubio | 231 | 14.53% | 1 | 0 | 1 |
| Donald Trump | 112 | 7.04% | 1 | 0 | 1 |
| John Kasich | 42 | 2.64% | 0 | 0 | 0 |
| Others | 2 | 0.13% | 0 | 0 | 0 |
| Undeclared | 75 | 4.72% | 1 | 0 | 1 |
| Unprojected delegates: | 0 | 0 | 0 | ||
| Total: | 1,590 | 100% | 12 | 0 | 12 |
| Source: The Green Papers and Wyoming Republican Party | |||||
| Candidate | Votes | Percentage | Actual delegate count | ||
|---|---|---|---|---|---|
| Bound | Unbound | Total | |||
| Ted Cruz | 14 | 1 | 15 | ||
| (available) | 0 | 2 | 2 | ||
| Unprojected delegates: | 0 | 0 | 0 | ||
| Total: | 14 | 3 | 17 | ||
| Source: The Green Papers and Wyoming Republican Party | |||||
Democratic caucuses
| Wyoming Democratic caucuses, April 9, 2016 | |||||
|---|---|---|---|---|---|
| Candidate | County delegates | Estimated national delegates | |||
| Count | Percentage | Pledged | Unpledged | Total | |
| Bernie Sanders | 156 | 55.7% | 7 | 0 | 7 |
| Hillary Clinton | 124 | 44.3% | 7 | 4 | 11 |
| Uncommitted | — | – | – | – | |
| Total | 100% | 14 | 4 | 18 | |
| Source: The Green Papers | |||||
General election
Voting History
Wyoming is the least populous of all 50 U.S. states. With almost 60% of the population identifying with or leaning towards the Republican Party, compared to less than 30% identifying with or leaning towards the Democrats, it is also the most solid Republican state, ahead of Idaho and Utah.[10] In the 2012 presidential election, incumbent President Barack Obama received less than 28% of the votes, trailing Mitt Romney by more than 40 points.
Predictions
| Source | Ranking | As of |
|---|---|---|
| Los Angeles Times[11] | Safe R | November 6, 2016 |
| CNN[12] | Safe R | November 4, 2016 |
| Cook Political Report[13] | Safe R | November 7, 2016 |
| Electoral-vote.com[14] | Safe R | November 8, 2016 |
| Rothenberg Political Report[15] | Safe R | November 7, 2016 |
| Sabato's Crystal Ball[16] | Safe R | November 7, 2016 |
| RealClearPolitics[17] | Safe R | November 8, 2016 |
| Fox News[18] | Safe R | November 7, 2016 |
Results
Chart of popular vote
| 2016 United States presidential election in Wyoming | ||||||
|---|---|---|---|---|---|---|
| Party | Candidate | Running mate | Votes | Percentage | Electoral votes | |
| Republican | Donald Trump | Mike Pence | 174,419 | 68.17% | 3 | |
| Democratic | Hillary Clinton | Tim Kaine | 55,973 | 21.88% | 0 | |
| Libertarian | Gary Johnson | William Weld | 13,287 | 5.19% | 0 | |
| Write-in | Various candidates | Various candidates | 6,904 | 2.70% | 0 | |
| Green | Jill Stein | Ajamu Baraka | 2,515 | 0.98% | 0 | |
| Constitution | Darrell Castle | Scott Bradley | 2,042 | 0.80% | 0 | |
| Reform/ADP | Rocky De La Fuente | Micheal Steinberg | 709 | 0.28% | 0 | |
| Totals | 255,849 | 100.00% | 3 | |||
County results
| County | Donald Trump Republican |
Hillary Clinton Democratic |
Others | Margin | Total votes cast | ||||
|---|---|---|---|---|---|---|---|---|---|
| # | % | # | % | # | % | # | % | ||
| Albany | 7,602 | 44.56% | 6,890 | 40.39% | 2,568 | 15.05% | 712 | 4.17% | 17,060 |
| Big Horn | 4,067 | 76.49% | 604 | 11.36% | 646 | 12.15% | 3,463 | 65.13% | 5,317 |
| Campbell | 15,778 | 86.70% | 1,324 | 7.28% | 1,097 | 6.03% | 14,454 | 79.42% | 18,199 |
| Carbon | 4,409 | 69.17% | 1,279 | 20.07% | 686 | 10.76% | 3,130 | 49.10% | 6,374 |
| Converse | 5,520 | 82.96% | 668 | 10.04% | 466 | 7.00% | 4,852 | 72.92% | 6,654 |
| Crook | 3,348 | 87.51% | 273 | 7.14% | 205 | 5.36% | 3,075 | 80.37% | 3,826 |
| Fremont | 11,167 | 65.60% | 4,200 | 24.67% | 1,656 | 9.73% | 6,967 | 40.93% | 17,023 |
| Goshen | 4,418 | 76.22% | 924 | 15.94% | 454 | 7.83% | 3,494 | 60.28% | 5,796 |
| Hot Springs | 1,939 | 74.98% | 400 | 15.47% | 247 | 9.55% | 1,539 | 59.51% | 2,586 |
| Johnson | 3,477 | 78.72% | 638 | 14.44% | 302 | 6.84% | 2,839 | 64.28% | 4,417 |
| Laramie | 24,847 | 60.65% | 11,573 | 28.25% | 4,549 | 11.10% | 13,274 | 32.40% | 40,969 |
| Lincoln | 6,779 | 76.38% | 1,105 | 12.45% | 991 | 11.17% | 5,674 | 63.93% | 8,875 |
| Natrona | 23,552 | 70.62% | 6,577 | 19.72% | 3,219 | 9.65% | 16,975 | 50.90% | 33,348 |
| Niobrara | 1,116 | 84.93% | 115 | 8.75% | 83 | 6.32% | 1,001 | 76.18% | 1,314 |
| Park | 11,115 | 73.63% | 2,535 | 16.79% | 1,445 | 9.57% | 8,580 | 56.84% | 15,095 |
| Platte | 3,437 | 75.89% | 719 | 15.88% | 373 | 8.24% | 2,718 | 60.01% | 4,529 |
| Sheridan | 10,266 | 70.75% | 2,927 | 20.17% | 1,317 | 9.08% | 7,339 | 50.58% | 14,510 |
| Sublette | 3,409 | 77.65% | 644 | 14.67% | 337 | 7.68% | 2,765 | 62.98% | 4,390 |
| Sweetwater | 12,154 | 70.95% | 3,231 | 18.86% | 1,745 | 10.19% | 8,923 | 52.09% | 17,130 |
| Teton | 3,921 | 31.05% | 7,314 | 57.92% | 1,392 | 11.02% | -3,393 | -26.87% | 12,627 |
| Uinta | 6,154 | 72.66% | 1,202 | 14.19% | 1,114 | 13.15% | 4,952 | 58.47% | 8,470 |
| Washakie | 2,911 | 76.32% | 532 | 13.95% | 371 | 9.73% | 2,379 | 62.37% | 3,814 |
| Weston | 3,033 | 86.02% | 299 | 8.48% | 194 | 5.50% | 2,734 | 77.54% | 3,526 |
| Total | 174,419 | 68.17% | 55,973 | 21.88% | 25,457 | 9.95% | 118,446 | 46.29% | 255,849 |
By congressional district
Due to the state's low population, only one congressional district is allocated. This district is called the At-Large district, because it covers the entire state, and thus is equivalent to the statewide election results.
| District | Trump | Clinton | Representative |
|---|---|---|---|
| At-large | 68.17% | 21.88% | Liz Cheney |
References
- "Wyoming voter registration and voter turnout statistics" (PDF). Wyoming Election Division. December 11, 2014. Archived (PDF) from the original on December 11, 2014. Retrieved August 9, 2022.
- "Wyoming Official Election Results 2016 General Election – Wyoming Secretary of State" (PDF). State of Wyoming. 2016. Archived (PDF) from the original on November 18, 2016. Retrieved November 17, 2016.
- "2016 Presidential Election Statistics". Dave Leip’s Atlas of U.S. Presidential Elections. Archived from the original on January 8, 2017. Retrieved March 5, 2018.
- "United States House of Representatives floor summary for Jan 8, 2009". Clerk.house.gov. Archived from the original on April 2, 2012. Retrieved January 30, 2009.
- "Federal elections 2008" (PDF). Federal Election Commission. Archived from the original (PDF) on August 13, 2009. Retrieved May 11, 2015.
- "President Map". The New York Times. November 29, 2012. Archived from the original on July 9, 2022. Retrieved May 11, 2015.
- "Presidential Approval Ratings: Barack Obama". Gallup. March 9, 2008. Archived from the original on August 6, 2022. Retrieved January 19, 2016.
- "Election Other – President Obama Job Approval". RealClearPolitics. Archived from the original on January 13, 2016. Retrieved December 24, 2015.
- McCain Nelson, Colleen. "Joe Biden Decides Not to Enter Presidential Race". The Wall Street Journal. Retrieved October 21, 2015.
- Jeffrey M. Jones (February 3, 2016). "Red States Outnumber Blue for First Time in Gallup Tracking". Gallup. Retrieved April 9, 2016.
- "Our final map has Clinton winning with 352 electoral votes. Compare your picks with ours". Los Angeles Times. November 6, 2016. Archived from the original on November 7, 2016. Retrieved November 13, 2016.
- Chalian, David (November 4, 2016). "Road to 270: CNN's new election map". CNN. Archived from the original on November 5, 2016. Retrieved March 3, 2019.
- "2016 Electoral Scorecard". The Cook Political Report. November 7, 2016. Archived from the original on February 16, 2017. Retrieved March 3, 2019.
- "2016 Electoral Map Prediction". Electoral-vote.com. November 8, 2016. Retrieved March 3, 2019.
- "Presidential Ratings". The Rothenberg Political Report. Retrieved August 16, 2021.
- Sabato, Larry J. (November 7, 2016). "2016 President". University of Virginia Center for Politics. Retrieved March 3, 2019.
- "2016 Election Maps - Battle for White House". RealClearPolitics. Retrieved November 13, 2016.
- "Electoral Scorecard: Map shifts again in Trump's favor, as Clinton holds edge". Fox News. November 7, 2016. Retrieved November 13, 2016.
External links
- RNC 2016 Republican Nominating Process Archived 2016-11-08 at the Wayback Machine
- Green papers for 2016 primaries, caucuses, and conventions