1940 United States presidential election in Wyoming
The 1940 United States presidential election in Wyoming took place on November 5, 1940, as part of the 1940 United States presidential election. State voters chose three representatives, or electors, to the Electoral College, who voted for president and vice president.
| ||||||||||||||||||||||||||
| ||||||||||||||||||||||||||
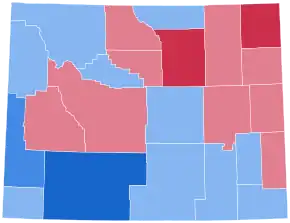 County Results
| ||||||||||||||||||||||||||
| ||||||||||||||||||||||||||
| Elections in Wyoming |
|---|
 |
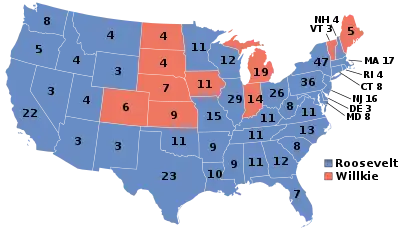
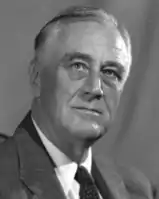
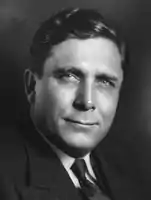
Wyoming was won by incumbent Democratic President Franklin D. Roosevelt, running with the 11th Secretary of Agriculture, Henry A. Wallace, as his Vice President, with 52.82 percent of the popular vote, against the Republican candidate, lawyer and corporate executive Wendell Willkie, running with Oregon senator Charles L. McNary, with 46.89 percent of the popular vote.[1] Willkie outperformed Alf Landon's 1936 result by seventeen points, and flipped 9 counties that Landon lost (Big Horn, Campell, Converse, Fremont, Goshen, Niobrara, Sublette, Washakie, and Weston).
Roosevelt decided to run for an unprecedented third term after Germany invaded Poland in September of 1939. With the American public strongly against intervention in Europe, Roosevelt and Wilkie both campaigned against involvement in the war, though the Republican campaign accused Roosevelt of secretly attempting to bring the nation into the war.[2]
This would be the last occasion that Teton County would vote for a Democratic presidential candidate until Bill Clinton carried the county in 1992 – since then it has become a Democratic island in the nation's "reddest" state.[3] This would also be the antepenultimate time that Wyoming would back the Democratic candidate in a presidential election, followed only by 1948 and 1964.
Results
| Party | Candidate | Votes | % | |
|---|---|---|---|---|
| Democratic | Franklin D. Roosevelt (incumbent) | 59,287 | 52.82% | |
| Republican | Wendell Willkie | 52,633 | 46.89% | |
| Prohibition | Roger W. Babson | 172 | 0.15% | |
| Socialist | Norman Thomas | 148 | 0.13% | |
| Total votes | 112,240 | 100.00% | ||
Results by county
| County | Franklin Delano Roosevelt Democratic |
Wendell Lewis Willkie Republican |
Roger Ward Babson[4] Prohibition |
Norman Mattoon Thomas[4] Socialist |
Margin | Total votes cast[5] | |||||
|---|---|---|---|---|---|---|---|---|---|---|---|
| # | % | # | % | # | % | # | % | # | % | ||
| Albany | 4,018 | 59.05% | 2,756 | 40.51% | 16 | 0.24% | 14 | 0.21% | 1,262 | 18.55% | 6,804 |
| Big Horn | 2,594 | 47.38% | 2,859 | 52.22% | 13 | 0.24% | 9 | 0.16% | -265 | -4.84% | 5,475 |
| Campbell | 1,128 | 42.17% | 1,540 | 57.57% | 3 | 0.11% | 4 | 0.15% | -412 | -15.40% | 2,675 |
| Carbon | 3,429 | 54.26% | 2,882 | 45.60% | 6 | 0.09% | 3 | 0.05% | 547 | 8.66% | 6,320 |
| Converse | 1,395 | 42.45% | 1,889 | 57.49% | 2 | 0.06% | 0 | 0.00% | -494 | -15.03% | 3,286 |
| Crook | 869 | 38.92% | 1,359 | 60.86% | 3 | 0.13% | 2 | 0.09% | -490 | -21.94% | 2,233 |
| Fremont | 2,644 | 40.97% | 3,788 | 58.70% | 9 | 0.14% | 12 | 0.19% | -1,144 | -17.73% | 6,453 |
| Goshen | 1,982 | 40.80% | 2,861 | 58.89% | 10 | 0.21% | 5 | 0.10% | -879 | -18.09% | 4,858 |
| Hot Springs | 1,266 | 57.70% | 913 | 41.61% | 8 | 0.36% | 7 | 0.32% | 353 | 16.09% | 2,194 |
| Johnson | 781 | 34.76% | 1,460 | 64.98% | 3 | 0.13% | 3 | 0.13% | -679 | -30.22% | 2,247 |
| Laramie | 7,808 | 56.50% | 5,955 | 43.09% | 26 | 0.19% | 31 | 0.22% | 1,853 | 13.41% | 13,820 |
| Lincoln | 2,839 | 61.65% | 1,765 | 38.33% | 1 | 0.02% | 0 | 0.00% | 1,074 | 23.32% | 4,605 |
| Natrona | 6,373 | 53.34% | 5,555 | 46.49% | 10 | 0.08% | 11 | 0.09% | 818 | 6.85% | 11,949 |
| Niobrara | 1,200 | 45.59% | 1,427 | 54.22% | 3 | 0.11% | 2 | 0.08% | -227 | -8.62% | 2,632 |
| Park | 2,747 | 52.01% | 2,512 | 47.56% | 19 | 0.36% | 4 | 0.08% | 235 | 4.45% | 5,282 |
| Platte | 1,849 | 51.05% | 1,758 | 48.54% | 4 | 0.11% | 11 | 0.30% | 91 | 2.51% | 3,622 |
| Sheridan | 4,439 | 53.69% | 3,814 | 46.13% | 12 | 0.15% | 3 | 0.04% | 625 | 7.56% | 8,268 |
| Sublette | 627 | 44.72% | 771 | 54.99% | 1 | 0.07% | 3 | 0.21% | -144 | -10.27% | 1,402 |
| Sweetwater | 6,637 | 72.98% | 2,439 | 26.82% | 10 | 0.11% | 8 | 0.09% | 4,198 | 46.16% | 9,094 |
| Teton | 728 | 53.81% | 623 | 46.05% | 1 | 0.07% | 1 | 0.07% | 105 | 7.76% | 1,353 |
| Uinta | 2,007 | 59.89% | 1,335 | 39.84% | 6 | 0.18% | 3 | 0.09% | 672 | 20.05% | 3,351 |
| Washakie | 942 | 46.34% | 1,080 | 53.12% | 5 | 0.25% | 6 | 0.30% | -138 | -6.79% | 2,033 |
| Weston | 985 | 43.13% | 1,292 | 56.57% | 1 | 0.04% | 6 | 0.26% | -307 | -13.44% | 2,284 |
| Totals | 59,287 | 52.82% | 52,633 | 46.89% | 172 | 0.15% | 148 | 0.13% | 6,654 | 5.93% | 112,240 |
References
- "1940 Presidential General Election Results - Wyoming". Retrieved April 9, 2023.
- John W. Jeffries, A Third Term for FDR: The Election of 1940 (2017)
- Menendez, Albert J.; The Geography of Presidential Elections in the United States, 1868-2004, pp. 342-343 ISBN 0786422173
- Our Campaigns; WY US Presidential Election, November 05, 1940
- Scammon, Richard M. (compiler); America at the Polls: A Handbook of Presidential Election Statistics 1920-1964; p. 515 ISBN 0405077114