1936 United States presidential election in Wyoming
The 1936 United States presidential election in Wyoming took place on November 3, 1936, as part of the 1936 United States presidential election. State voters chose three representatives, or electors, to the Electoral College, who voted for president and vice president.
| ||||||||||||||||||||||||||
| ||||||||||||||||||||||||||
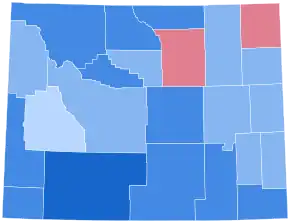 County Results
| ||||||||||||||||||||||||||
| ||||||||||||||||||||||||||
.jpg.webp)
.jpg.webp)
| Elections in Wyoming |
|---|
 |
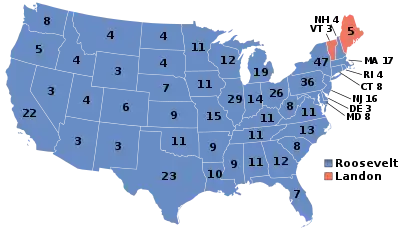
Wyoming was won by the Democratic candidate, incumbent President Franklin D. Roosevelt, running with John Nance Garner, who was the 39th and incumbent Speaker of the United States House of Representatives, with 60.58 percent of the popular vote, against the Republican candidate, Alf Landon, who was the Governor of Kansas, running with future Secretary of the Navy Frank Knox, with 37.47 percent of the popular vote.[1] Despite Landon losing by over 23 percent (a wider margin than Herbert Hoover had four years earlier), Wyoming was nonetheless the Republican nominee's strongest state west of the Great Plains, and voted 0.93% more Republican than the nation.
As of the 2020 presidential election, this is the best ever performance by a Democratic presidential nominee in Wyoming, and the last election in which a Democrat has carried Campbell, Converse, Niobrara, Sublette, Washakie or Weston Counties.[2]
Roosevelt flipped Big Horn County, which had narrowly backed Herbert Hoover in 1932. Despite losing by more than Hoover had, however, Landon flipped Crook and Johnson Counties from Roosevelt; neither has voted for a Democrat since. Big Horn County would not vote for a Democratic Presidential candidate again until it narrowly backed Lyndon B. Johnson in 1964, and never since. This would be the last time that any candidate won Wyoming by double digits until Republican Dwight Eisenhower did in 1952, and the penultimate time a Democrat would.
Roosevelt's victory was a reflection of a nationwide realignment towards the Democratic Party that took place throughout the 1930s.[3] Democrats had won the governorship of Wyoming in 1932, and in the 1934 midterms Democrats gained the Secretary of State, Auditor, Treasurer, and Superintendent of Public Instruction offices from the Republicans. Along with Roosevelt's landslide reelection in the state, Democrat Harry Schwartz defeated incumbent Republican Senator Robert D. Carey in the concurrent Senate race, thus giving Democrats control of all statewide elected offices for the only time in the state's history.
Results
| Party | Candidate | Votes | % | |
|---|---|---|---|---|
| Democratic | Franklin D. Roosevelt (incumbent) | 62,624 | 60.58% | |
| Republican | Alfred Landon | 38,739 | 37.47% | |
| Union | William Lemke | 1,653 | 1.60% | |
| Socialist | Norman Thomas | 200 | 0.19% | |
| Communist | Earl Browder | 91 | 0.09% | |
| Prohibition | D. Leigh Colvin | 75 | 0.07% | |
| Total votes | 103,382 | 100.00% | ||
Results by county
| County | Franklin Delano Roosevelt Democratic |
Alfred Mossman Landon Republican |
William Frederick Lemke[4] Union |
Various candidates Other parties |
Margin | Total votes cast[5] | |||||
|---|---|---|---|---|---|---|---|---|---|---|---|
| # | % | # | % | # | % | # | % | # | % | ||
| Albany | 3,685 | 66.53% | 1,777 | 32.08% | 49 | 0.88% | 28 | 0.51% | 1,908 | 34.45% | 5,539 |
| Big Horn | 3,156 | 60.28% | 1,996 | 38.12% | 73 | 1.39% | 11 | 0.21% | 1,160 | 22.15% | 5,236 |
| Campbell | 1,435 | 51.54% | 1,322 | 47.49% | 21 | 0.75% | 6 | 0.22% | 113 | 4.06% | 2,784 |
| Carbon | 3,257 | 60.62% | 2,041 | 37.99% | 51 | 0.95% | 24 | 0.45% | 1,216 | 22.63% | 5,373 |
| Converse | 1,639 | 50.42% | 1,556 | 47.86% | 34 | 1.05% | 22 | 0.68% | 83 | 2.55% | 3,251 |
| Crook | 1,088 | 46.30% | 1,218 | 51.83% | 38 | 1.62% | 6 | 0.26% | -130 | -5.53% | 2,350 |
| Fremont | 3,050 | 55.12% | 2,357 | 42.60% | 107 | 1.93% | 19 | 0.34% | 693 | 12.52% | 5,533 |
| Goshen | 2,639 | 55.55% | 2,047 | 43.09% | 47 | 0.99% | 18 | 0.38% | 592 | 12.46% | 4,751 |
| Hot Springs | 1,419 | 61.19% | 796 | 34.33% | 89 | 3.84% | 15 | 0.65% | 623 | 26.87% | 2,319 |
| Johnson | 949 | 40.68% | 1,266 | 54.26% | 109 | 4.67% | 9 | 0.39% | -317 | -13.59% | 2,333 |
| Laramie | 7,594 | 62.55% | 4,356 | 35.88% | 151 | 1.24% | 39 | 0.32% | 3,238 | 26.67% | 12,140 |
| Lincoln | 2,747 | 66.03% | 1,376 | 33.08% | 31 | 0.75% | 6 | 0.14% | 1,371 | 32.96% | 4,160 |
| Natrona | 7,819 | 65.67% | 3,810 | 32.00% | 241 | 2.02% | 37 | 0.31% | 4,009 | 33.67% | 11,907 |
| Niobrara | 1,124 | 50.07% | 1,086 | 48.37% | 28 | 1.25% | 7 | 0.31% | 38 | 1.69% | 2,245 |
| Park | 2,594 | 60.12% | 1,618 | 37.50% | 92 | 2.13% | 11 | 0.25% | 976 | 22.62% | 4,315 |
| Platte | 1,730 | 50.79% | 1,546 | 45.39% | 108 | 3.17% | 22 | 0.65% | 184 | 5.40% | 3,406 |
| Sheridan | 4,731 | 61.60% | 2,726 | 35.49% | 204 | 2.66% | 19 | 0.25% | 2,005 | 26.11% | 7,680 |
| Sublette | 667 | 49.85% | 638 | 47.68% | 27 | 2.02% | 6 | 0.45% | 29 | 2.17% | 1,338 |
| Sweetwater | 6,232 | 76.97% | 1,797 | 22.19% | 32 | 0.40% | 36 | 0.44% | 4,435 | 54.77% | 8,097 |
| Teton | 795 | 58.80% | 501 | 37.06% | 51 | 3.77% | 5 | 0.37% | 294 | 21.75% | 1,352 |
| Uinta | 1,972 | 65.41% | 1,015 | 33.67% | 21 | 0.70% | 7 | 0.23% | 957 | 31.74% | 3,015 |
| Washakie | 1,109 | 56.50% | 810 | 41.26% | 34 | 1.73% | 10 | 0.51% | 299 | 15.23% | 1,963 |
| Weston | 1,193 | 51.98% | 1,084 | 47.23% | 15 | 0.65% | 3 | 0.13% | 109 | 4.75% | 2,295 |
| Totals | 62,624 | 60.58% | 38,739 | 37.47% | 1,653 | 1.60% | 366 | 0.35% | 23,885 | 23.10% | 103,382 |
References
- "1936 Presidential Election Results Wyoming". Dave Leip’s U.S. Election Atlas.
- Sullivan, Robert David; ‘How the Red and Blue Map Evolved Over the Past Century’; America Magazine in The National Catholic Review; June 29, 2016
- Larson, T. A. (1969). "The New Deal in Wyoming". Pacific Historical Review. 38 (3): 249–273. doi:10.2307/3636099. JSTOR 3636099.
- Géoelections; 1936 Presidential Election Popular Vote (.xlsx file for €15 on request)
- Scammon, Richard M. (compiler); America at the Polls: A Handbook of Presidential Election Statistics 1920-1964; p. 516 ISBN 0405077114