1932 United States presidential election in Wyoming
The 1932 United States presidential election in Wyoming took place on November 8, 1932, as part of the 1932 United States presidential election. State voters chose three representatives, or electors, to the Electoral College, who voted for president and vice president.
| ||||||||||||||||||||||||||
| ||||||||||||||||||||||||||
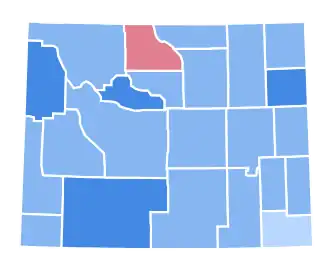 County Results
| ||||||||||||||||||||||||||
| ||||||||||||||||||||||||||
.jpg.webp)
.jpg.webp)
| Elections in Wyoming |
|---|
 |
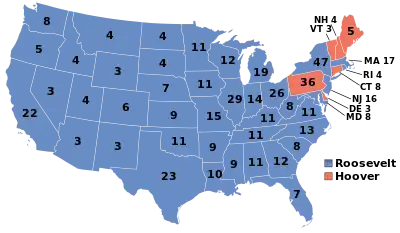
Wyoming was won by the Democratic nominee, the 44th Governor of New York, Franklin D. Roosevelt, running with John Nance Garner, the 39th Speaker of the United States House of Representatives, with 56.07 percent of the popular vote, against the incumbent Republican President Herbert Hoover and Vice President Charles Curtis, with 40.82 percent of the popular vote.[1] As of the 2020 presidential election, this is the last election in which Johnson County and Crook County have voted for a Democratic presidential candidate.[2]
While Hoover had easily carried Wyoming over Al Smith in 1928, Roosevelt comfortably overturned that margin and in the process flipped twenty-one counties that Hoover had won in 1928 (Albany, Campbell, Carbon, Converse, Crook, Fremont, Goshen, Hot Springs, Johnson, Laramie, Lincoln, Natrona, Niobrara, Park, Platte, Sheridan, Sublette, Teton, Uinta, Washakie, and Weston). Whereas in 1928 Hoover lost only heavily unionized Sweetwater County in Wyoming, this election would see the reverse, with the embattled incumbent only winning Big Horn County. Hoover's statewide vote share was the worst for a Republican since the three-way race of 1912, and he lost the state by a much larger margin than William Howard Taft had in that election. Roosevelt's 15.3% margin of victory in Wyoming made the state 2.5% more Republican than the nation.
Though the previous decade had been a fiercely Republican age in American politics, with the beginning of the Great Depression in 1929 voters blamed Republicans for the economic downturn. Roosevelt promised to enact a serious of legislative proposals, collectively called the New Deal, to end the Depression. Roosevelt campaigned cautiously, trying to minimize gaffes while keeping the attention on his unpopular opponent, who was publicly opposed even by numerous prominent Republicans such as Senator Bronson Cutting and agriculturist Henry Wallace.[3] Though both campaigns spent heavily on radio, Roosevelt employed it more effectively, using it to craft a persona that voters believed cared about them and campaign in spite of his polio-inflicted disability.
Roosevelt's victory was the beginning of a major realignment in American politics, forming the New Deal coalition. During this period, Democrats maintained a firm grip on Congress, controlling both chambers until 1980 with the exceptions of 1947-49 and 1951–53.
Results
| Party | Candidate | Votes | % | |
|---|---|---|---|---|
| Democratic | Franklin D. Roosevelt | 54,370 | 56.07% | |
| Republican | Herbert Hoover (incumbent) | 39,583 | 40.82% | |
| Socialist | Norman Thomas | 2,829 | 2.92% | |
| Communist | William Foster | 180 | 0.19% | |
| Total votes | 96,962 | 100.00% | ||
Results by county
| County | Franklin Delano Roosevelt Democratic |
Herbert Clark Hoover Republican |
Norman Mattoon Thomas[4] Socialist |
William Z. Foster[4] Communist |
Margin | Total votes cast[5] | |||||
|---|---|---|---|---|---|---|---|---|---|---|---|
| # | % | # | % | # | % | # | % | # | % | ||
| Albany | 2,665 | 50.39% | 2,281 | 43.13% | 337 | 6.37% | 6 | 0.11% | 384 | 7.26% | 5,289 |
| Big Horn | 2,155 | 47.23% | 2,334 | 51.15% | 73 | 1.60% | 1 | 0.02% | -179 | -3.92% | 4,563 |
| Campbell | 1,728 | 57.99% | 1,161 | 38.96% | 83 | 2.79% | 8 | 0.27% | 567 | 19.03% | 2,980 |
| Carbon | 2,836 | 55.90% | 2,088 | 41.16% | 124 | 2.44% | 25 | 0.49% | 748 | 14.74% | 5,073 |
| Converse | 1,860 | 53.49% | 1,569 | 45.13% | 46 | 1.32% | 2 | 0.06% | 291 | 8.36% | 3,477 |
| Crook | 1,317 | 54.58% | 1,062 | 44.01% | 34 | 1.41% | 0 | 0.00% | 255 | 10.57% | 2,413 |
| Fremont | 2,612 | 59.72% | 1,696 | 38.77% | 61 | 1.39% | 5 | 0.11% | 916 | 20.95% | 4,374 |
| Goshen | 2,545 | 55.45% | 1,954 | 42.57% | 76 | 1.66% | 15 | 0.33% | 591 | 12.88% | 4,590 |
| Hot Springs | 1,466 | 62.30% | 742 | 31.53% | 133 | 5.65% | 12 | 0.51% | 724 | 30.77% | 2,353 |
| Johnson | 1,171 | 50.04% | 1,101 | 47.05% | 68 | 2.91% | 0 | 0.00% | 70 | 2.99% | 2,340 |
| Laramie | 5,435 | 49.69% | 5,116 | 46.77% | 383 | 3.50% | 4 | 0.04% | 319 | 2.92% | 10,938 |
| Lincoln | 2,275 | 56.79% | 1,673 | 41.76% | 55 | 1.37% | 3 | 0.07% | 602 | 15.03% | 4,006 |
| Natrona | 6,777 | 58.76% | 4,368 | 37.87% | 372 | 3.23% | 16 | 0.14% | 2,409 | 20.89% | 11,533 |
| Niobrara | 1,237 | 56.61% | 908 | 41.56% | 39 | 1.78% | 1 | 0.05% | 329 | 15.05% | 2,185 |
| Park | 2,043 | 54.38% | 1,600 | 42.59% | 113 | 3.01% | 1 | 0.03% | 443 | 11.79% | 3,757 |
| Platte | 1,893 | 52.24% | 1,430 | 39.46% | 296 | 8.17% | 5 | 0.14% | 463 | 12.78% | 3,624 |
| Sheridan | 4,260 | 59.65% | 2,738 | 38.34% | 143 | 2.00% | 1 | 0.01% | 1,522 | 21.31% | 7,142 |
| Sublette | 633 | 54.01% | 512 | 43.69% | 25 | 2.13% | 2 | 0.17% | 121 | 10.32% | 1,172 |
| Sweetwater | 4,637 | 66.40% | 2,043 | 29.26% | 239 | 3.42% | 64 | 0.92% | 2,594 | 37.14% | 6,983 |
| Teton | 699 | 62.69% | 406 | 36.41% | 10 | 0.90% | 0 | 0.00% | 293 | 26.28% | 1,115 |
| Uinta | 1,658 | 56.05% | 1,250 | 42.26% | 44 | 1.49% | 6 | 0.20% | 408 | 13.79% | 2,958 |
| Washakie | 1,009 | 57.62% | 711 | 40.61% | 30 | 1.71% | 1 | 0.06% | 298 | 17.01% | 1,751 |
| Weston | 1,459 | 62.19% | 840 | 35.81% | 45 | 1.92% | 2 | 0.09% | 619 | 26.38% | 2,346 |
| Totals | 54,370 | 56.07% | 39,583 | 40.82% | 2,829 | 2.92% | 180 | 0.19% | 14,787 | 15.25% | 96,962 |
References
- "1932 Presidential Election Results – Wyoming".
- Sullivan, Robert David; ‘How the Red and Blue Map Evolved Over the Past Century’; America Magazine in The National Catholic Review; June 29, 2016
- "Timeline of the Great Depression". www.hyperhistory.com. Retrieved February 12, 2023.
- Our Campigns; WY US President Race, November 08, 1932
- Scammon, Richard M. (compiler); America at the Polls: A Handbook of Presidential Election Statistics 1920-1964; p. 515 ISBN 0405077114