2016 United States presidential election in Alaska
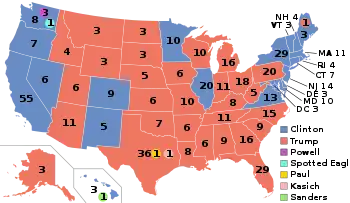
The 2016 United States presidential election in Alaska was held on Tuesday, November 8, 2016, as part of the nationwide presidential election in which all 50 states plus the District of Columbia participated. Alaska voters chose electors to represent them in the Electoral College via a popular vote, pitting the Republican Party's nominee, businessman Donald Trump, and running mate Indiana Governor Mike Pence against Democratic Party nominee, former Secretary of State Hillary Clinton, and her running mate Virginia Senator Tim Kaine. Alaska has three electoral votes in the Electoral College.[1]
| |||||||||||||||||||||||||||||||||
| Turnout | 60.77% | ||||||||||||||||||||||||||||||||
|---|---|---|---|---|---|---|---|---|---|---|---|---|---|---|---|---|---|---|---|---|---|---|---|---|---|---|---|---|---|---|---|---|---|
| |||||||||||||||||||||||||||||||||
| |||||||||||||||||||||||||||||||||
| |||||||||||||||||||||||||||||||||
| Elections in Alaska |
|---|
 |
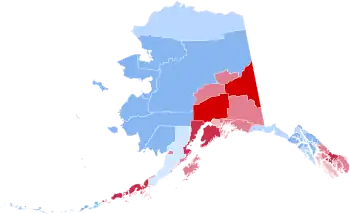
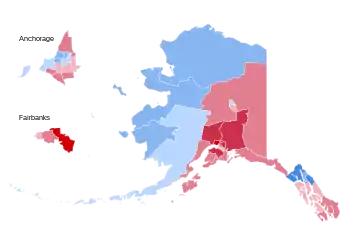
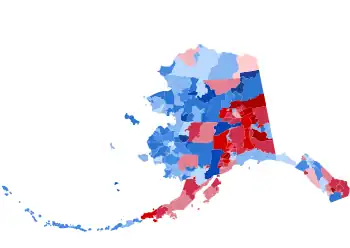
Trump carried the state with 51.28% of the vote, while Clinton received 36.55% of the vote.[2] This marked a return to Alaska's streak of giving Democrats under 40% of the vote share, after Barack Obama won just over 40% in 2012. Alaska has voted Republican in every election since 1968, and since its admission to the Union in 1959, it has only voted for the Democratic candidate on one occasion: Lyndon B. Johnson in 1964.[3] Clinton was able to flip Haines Borough Democratic for the first time since 1992.
The state is known for strongly supporting third parties, including Libertarian candidate Gary Johnson in 2012; Alaska was his third-strongest state. He ran again as the Libertarian Party's 2016 nominee and appeared on the ballot in Alaska. On the day of the election, he garnered 5.88% of the vote, making Alaska his third-strongest state again after New Mexico and North Dakota.[4] Johnson's performance was the best for a Libertarian since 1980, and the best third party performance since Ralph Nader in 2000.
This is the first time since 1984 that a Republican won without Kusilvak Census Area, the first time since 1980 that they won without Nome, Yukon–Koyukuk Census Area, Northwest Arctic Borough, and Dillingham Census Area. The first since 1972 to win without North Slope Borough. The first ever to win without Aleutians West Census Area, Haines Borough, and Lake and Peninsula Borough.
Caucuses
The incumbent President of the United States, Barack Obama, a Democrat and former U.S. Senator from Illinois, was first elected president in the 2008 election, running with former Senator Joe Biden of Delaware. Defeating the Republican nominee, Senator John McCain of Arizona, with 52.9% of the popular vote and 68% of the electoral vote,[5][6] Obama succeeded two-term Republican President George W. Bush, the former Governor of Texas. Obama and Biden were reelected in the 2012 presidential election, defeating former Massachusetts Governor Mitt Romney with 51.1% of the popular vote and 61.7% of electoral votes.[7] Although Barack Obama's approval rating in the RealClearPolitics poll tracking average remained between 40 and 50 percent for most of his second term, it has experienced a surge in early 2016 and reached its highest point since 2012 during June of that year.[8][9] Analyst Nate Cohn has noted that a strong approval rating for President Obama would equate to a strong performance for the Democratic candidate, and vice versa.[10]
Following his second term, President Obama was not eligible for another reelection. In October 2015, Obama's running-mate and two-term Vice President Biden decided not to enter the race for the Democratic presidential nomination either.[11] With their term expiring on January 20, 2017, the electorate is asked to elect a new president, the 45th president and 48th vice president of the United States, respectively. The two major parties chose delegates on different days.[12]
Democratic caucuses
| |||||||||||||||||||
| |||||||||||||||||||
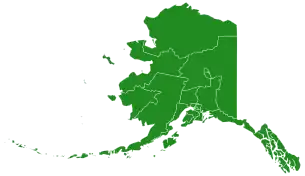 Alaska results by state house district
Bernie Sanders | |||||||||||||||||||
Opinion polling
| Candidate | Popular vote | District delegates | Estimated delegates | ||||
|---|---|---|---|---|---|---|---|
| Count | Percentage | Count | Percentage | Pledged | Unpledged | Total | |
| Bernie Sanders | 8,447 | 79.61% | 441 | 81.52% | 13 | 1 | 14 |
| Hillary Clinton | 2,146 | 20.23% | 100 | 18.48% | 3 | 1 | 4 |
| Rocky De La Fuente | 1 | <0.01% | |||||
| Uncommitted | 16 | 0.15% | 0 | 2 | 2 | ||
| Total | 10,610 | 100% | 541 | 100% | 16 | 4 | 20 |
| Source: The Green Papers | |||||||
Republican caucus
| |||||||||||||||||||||||||||||||||||||||||
| |||||||||||||||||||||||||||||||||||||||||
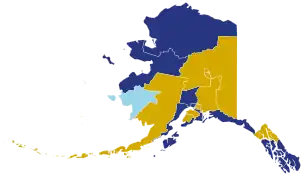 Alaska results by state house district
Ted Cruz
Donald Trump
Ben Carson | |||||||||||||||||||||||||||||||||||||||||
| Candidate | Votes | Percentage | Actual delegate count | ||
|---|---|---|---|---|---|
| Bound | Unbound | Total | |||
| Ted Cruz | 8,369 | 36.37% | 12 | 0 | 12 |
| Donald Trump | 7,740 | 33.64% | 11 | 0 | 11 |
| Marco Rubio | 3,488 | 15.16% | 5 | 0 | 5 |
| Ben Carson | 2,492 | 10.83% | 0 | 0 | 0 |
| John Kasich | 918 | 3.99% | 0 | 0 | 0 |
| Unprojected delegates: | 0 | 0 | 0 | ||
| Total: | 23,010 | 100.00% | 28 | 0 | 28 |
| Source: The Green Papers and Alaska Republican Party | |||||
Controversy
At the Republican National Convention, Alaska's floor votes were all recorded for Donald Trump by the convention secretary, even though the Alaska delegation read their votes according to the results of the caucuses: 12 for Cruz, 11 for Trump and 5 for Rubio. An Alaska delegate challenged the results as recorded.[13] However, RNC chair Reince Priebus defended the actions of the convention secretary, saying that the delegates were bound to Trump.[14]
General election
Political landscape in Alaska
The state of Alaska has given its electoral votes to the Republican ticket in every election year since 1968 and only once to a Democratic ticket since statehood. However, in 2012, it had the largest swing in favor of the Democratic Party with President Obama only losing by 14 points compared to his 2008 loss by 22 points.[15]
Alaska also has a history of supporting third-party candidates at the presidential level. Alaska was the second-best state for Ross Perot in the 1992 election, with Ross Perot garnering 28% of the vote. Alaska was Nader's strongest state in the 2000 presidential election, giving him 10% in his presidential bid.[16] Alaska was also the third-best state for Libertarian nominee Gary Johnson in the 2012 election, giving him 2.46% of the vote, behind Johnson's home state of New Mexico, and Montana.[17] For this reason, Alaska has been considered to be one of Libertarian party nominee Gary Johnson's strongest states in the 2016 election.
Predictions
The following are the final 2016 predictions from various organizations for Alaska as of Election Day.
| Source | Ranking | As of |
|---|---|---|
| Los Angeles Times[18] | Safe R | November 6, 2016 |
| CNN[19] | Safe R | November 8, 2016 |
| Rothenberg Political Report[20] | Safe R | November 7, 2016 |
| Sabato's Crystal Ball[21] | Likely R | November 7, 2016 |
| NBC[22] | Lean R | November 7, 2016 |
| RealClearPolitics[23] | Likely R | November 8, 2016 |
| Fox News[24] | Lean R | November 7, 2016 |
| ABC[25] | Lean R | November 7, 2016 |
Statewide results
| Party | Candidate | Votes | % | ±% | |
|---|---|---|---|---|---|
| Republican | Donald Trump | 163,387 | 51.28% | −3.52% | |
| Democratic | Hillary Clinton | 116,454 | 36.55% | −4.26% | |
| Libertarian | Gary Johnson | 18,725 | 5.88% | +3.42% | |
| Green | Jill Stein | 5,735 | 1.80% | +0.83% | |
| Constitution | Darrell Castle | 3,866 | 1.21% | N/A | |
| Reform | Rocky De La Fuente | 1,240 | 0.39% | N/A | |
| Write-in | 9,201 | 2.89% | N/A | ||
| Total votes | 318,608 | 100.00% | +1.17% | ||
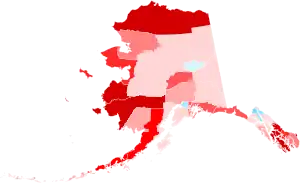
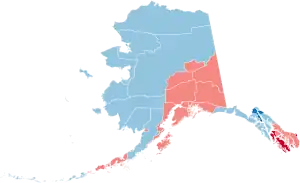
Boroughs and census areas that flipped from Democratic to Republican
- Prince of Wales–Hyder Census Area (largest city: Craig)[27]
Boroughs and census areas that flipped from Republican to Democratic
- Haines Borough (largest census-designated place: Haines)[27]
Results by Congressional District
Alaska has an at-large congressional equivalent to the statewide results.
Turnout
According to the Alaska Division of Election voter turnout was about 60.77%, 321,271 ballots were cast out of 528,671 voters.[28]
Electors
Alaska had 3 electors in 2016; all of them voted for Donald Trump for president and Mike Pence for vice president.
The electors were:
- Sean R. Parnell
- Jacqueline F. Tupou
- Carolyn B. Leman
See also
References
- "Distribution of Electoral Votes". National Archives and Records Administration. Archived from the original on January 9, 2019. Retrieved November 23, 2020.
- "Alaska Election Results 2016 – The New York Times". Retrieved November 29, 2016.
- "Alaska has a long history of voting strongly Republican for president. Will it continue?". Anchorage Daily News. November 6, 2016. Retrieved December 14, 2020.
- "2016 Presidential Election Statistics". Dave Leip’s Atlas of U.S. Presidential Elections. Retrieved March 5, 2018.
- "United States House of Representatives floor summary for Jan 8, 2009". Clerk.house.gov. Archived from the original on April 2, 2012. Retrieved January 30, 2009.
- "Federal elections 2008" (PDF). Federal Election Commission. Retrieved May 11, 2015.
- "President Map". The New York Times. November 29, 2012. Retrieved May 11, 2015.
- "Election Other – President Obama Job Approval". RealClearPolitics. Retrieved December 24, 2015.
- Byrnes, Jesse (June 15, 2016). "Poll: Obama approval rating highest since 2012". The Hill. Retrieved June 19, 2016.
- Cohn, Nate (January 19, 2015). "What a Rise in Obama's Approval Rating Means for 2016". The New York Times. ISSN 0362-4331. Retrieved June 19, 2016.
- "Joe Biden Decides Not to Enter Presidential Race". The Wall Street Journal. Retrieved October 21, 2015.
- Kitchenman, Andrew (February 12, 2016). "How and when do Alaskans get to weigh in on presidential candidates?". Ktoo.org. Retrieved November 13, 2016.
- Carlson, Emily. "Chairman of Alaska's Rep party said he doesn't know why 28 delegates went @realDonaldTrump but "it's going to be corrected in record" @ktva". Twitter. Retrieved July 23, 2016.
- Kopan, Tal; Payson-Denny, Wade. "Why Alaska's delegates were counted for Donald Trump". CNN. Turner Broadcasting System, Inc. Retrieved July 23, 2016.
- Silver, Nate (December 5, 2012). "Alaska: Future Swing State?". The New York Times. Retrieved July 31, 2016.
- Azari, Julia. "The States That Love (And Hate) Third-Party Candidates". FiveThirtyEight. FiveThirtyEight. Retrieved July 15, 2016.
- "2012 Presidential General Election Results - Alaska". Dave Leip's Atlas of US Elections. Retrieved October 24, 2016.
- "Our final map has Clinton winning with 352 electoral votes. Compare your picks with ours". Los Angeles Times. November 6, 2016. Retrieved November 13, 2016.
- "Road to 270: CNN's general election map - CNNPolitics.com". Cnn.com. November 8, 2016. Retrieved November 13, 2016.
- "Presidential Ratings". The Rothenberg Political Report. Retrieved August 16, 2021.
- "Larry J. Sabato's Crystal Ball » 2016 President". Centerforpolitics.org. November 7, 2016. Retrieved November 13, 2016.
- Todd, Chuck. "NBC's Final Battleground Map Shows Clinton With a Significant Lead". NBC News. Retrieved November 13, 2016.
- "2016 Election Maps - Battle for White House". RealClearPolitics. Retrieved November 13, 2016.
- "Electoral Scorecard: Map shifts again in Trump's favor, as Clinton holds edge". Fox News. November 7, 2016. Retrieved November 13, 2016.
- "The Final 15: The Latest Polls in the Swing States That Will Decide the Election". Abcnews.go.com. November 7, 2016. Retrieved November 13, 2016.
- "GEMS ELECTION RESULTS". www.elections.alaska.gov.
- "Alaska Presidential Results by County, 1960-2016|Maps". thecinyc. Retrieved August 31, 2020.
- "Voters history by age report" (PDF). elections.alaska.gov. Retrieved February 4, 2023.
.jpg.webp)


.jpg.webp)


